Luxembourger vs Indonesian College, Under 1 year
COMPARE
Luxembourger
Indonesian
College, Under 1 year
College, Under 1 year Comparison
Luxembourgers
Indonesians
68.2%
COLLEGE, UNDER 1 YEAR
98.1/ 100
METRIC RATING
92nd/ 347
METRIC RANK
61.2%
COLLEGE, UNDER 1 YEAR
0.3/ 100
METRIC RATING
259th/ 347
METRIC RANK
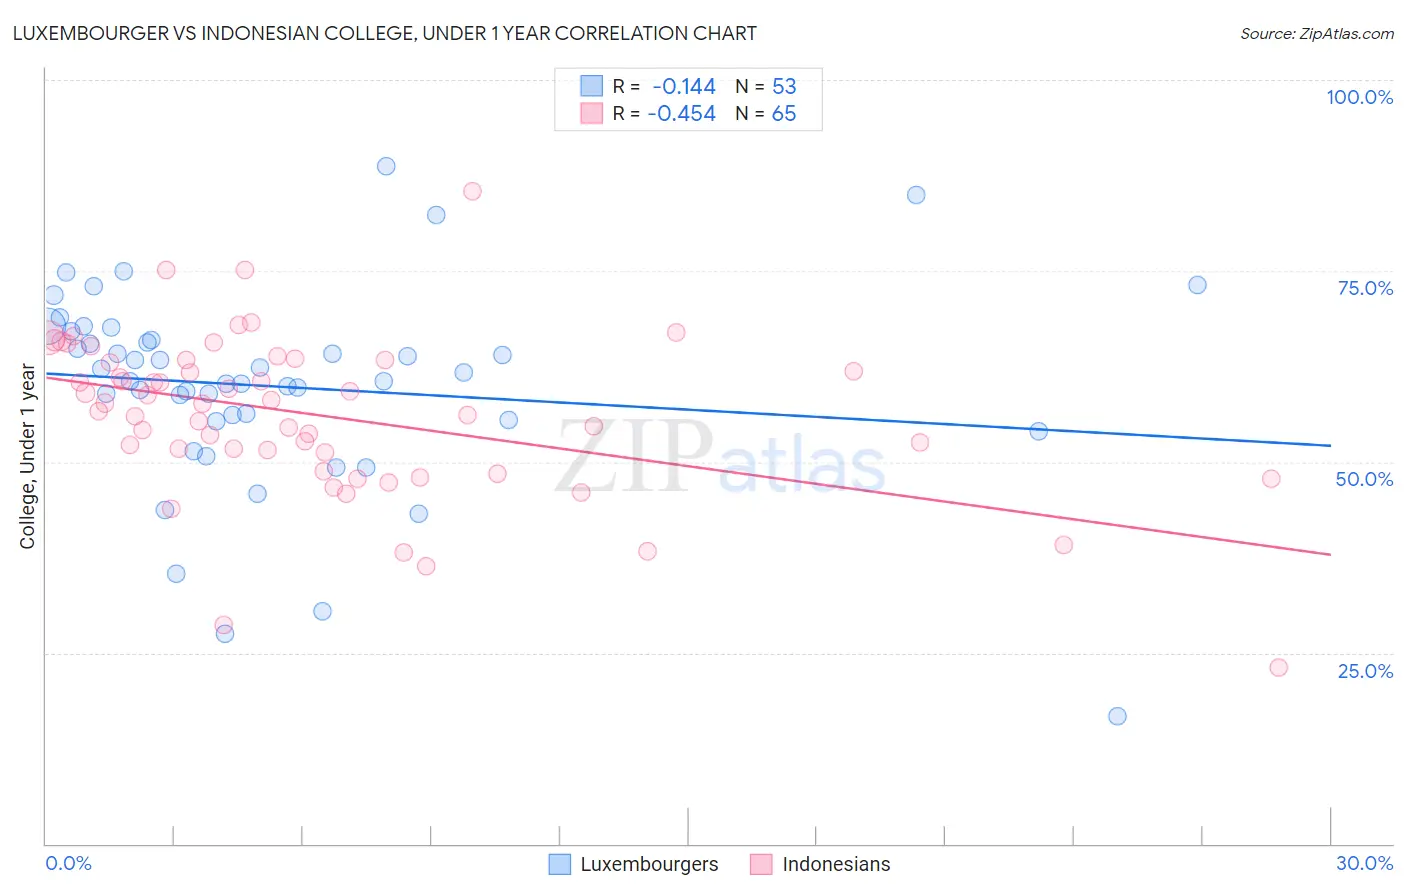
Luxembourger vs Indonesian College, Under 1 year Correlation Chart
The statistical analysis conducted on geographies consisting of 144,676,190 people shows a poor negative correlation between the proportion of Luxembourgers and percentage of population with at least college, under 1 year education in the United States with a correlation coefficient (R) of -0.144 and weighted average of 68.2%. Similarly, the statistical analysis conducted on geographies consisting of 162,726,213 people shows a moderate negative correlation between the proportion of Indonesians and percentage of population with at least college, under 1 year education in the United States with a correlation coefficient (R) of -0.454 and weighted average of 61.2%, a difference of 11.4%.
College, Under 1 year Correlation Summary
| Measurement | Luxembourger | Indonesian |
| Minimum | 16.7% | 23.1% |
| Maximum | 88.7% | 85.5% |
| Range | 72.1% | 62.4% |
| Mean | 59.8% | 56.1% |
| Median | 60.6% | 57.6% |
| Interquartile 25% (IQ1) | 55.4% | 50.0% |
| Interquartile 75% (IQ3) | 66.5% | 63.3% |
| Interquartile Range (IQR) | 11.1% | 13.3% |
| Standard Deviation (Sample) | 13.2% | 10.7% |
| Standard Deviation (Population) | 13.1% | 10.6% |
Similar Demographics by College, Under 1 year
Demographics Similar to Luxembourgers by College, Under 1 year
In terms of college, under 1 year, the demographic groups most similar to Luxembourgers are European (68.2%, a difference of 0.010%), Icelander (68.3%, a difference of 0.040%), Romanian (68.2%, a difference of 0.090%), Ethiopian (68.3%, a difference of 0.10%), and Croatian (68.3%, a difference of 0.11%).
| Demographics | Rating | Rank | College, Under 1 year |
| Egyptians | 98.3 /100 | #85 | Exceptional 68.3% |
| Immigrants | Lebanon | 98.3 /100 | #86 | Exceptional 68.3% |
| Chinese | 98.3 /100 | #87 | Exceptional 68.3% |
| Croatians | 98.2 /100 | #88 | Exceptional 68.3% |
| Ethiopians | 98.2 /100 | #89 | Exceptional 68.3% |
| Icelanders | 98.1 /100 | #90 | Exceptional 68.3% |
| Europeans | 98.1 /100 | #91 | Exceptional 68.2% |
| Luxembourgers | 98.1 /100 | #92 | Exceptional 68.2% |
| Romanians | 97.9 /100 | #93 | Exceptional 68.2% |
| Armenians | 97.7 /100 | #94 | Exceptional 68.1% |
| Immigrants | Pakistan | 97.5 /100 | #95 | Exceptional 68.0% |
| Jordanians | 97.4 /100 | #96 | Exceptional 68.0% |
| Immigrants | Ethiopia | 97.3 /100 | #97 | Exceptional 68.0% |
| Paraguayans | 97.1 /100 | #98 | Exceptional 67.9% |
| Immigrants | Bolivia | 97.0 /100 | #99 | Exceptional 67.9% |
Demographics Similar to Indonesians by College, Under 1 year
In terms of college, under 1 year, the demographic groups most similar to Indonesians are Immigrants from Bangladesh (61.3%, a difference of 0.020%), Immigrants from Laos (61.3%, a difference of 0.080%), Blackfeet (61.1%, a difference of 0.17%), Bangladeshi (61.4%, a difference of 0.20%), and African (61.1%, a difference of 0.20%).
| Demographics | Rating | Rank | College, Under 1 year |
| West Indians | 0.4 /100 | #252 | Tragic 61.5% |
| Japanese | 0.4 /100 | #253 | Tragic 61.5% |
| Immigrants | Cambodia | 0.4 /100 | #254 | Tragic 61.5% |
| Comanche | 0.4 /100 | #255 | Tragic 61.4% |
| Bangladeshis | 0.4 /100 | #256 | Tragic 61.4% |
| Immigrants | Laos | 0.3 /100 | #257 | Tragic 61.3% |
| Immigrants | Bangladesh | 0.3 /100 | #258 | Tragic 61.3% |
| Indonesians | 0.3 /100 | #259 | Tragic 61.2% |
| Blackfeet | 0.3 /100 | #260 | Tragic 61.1% |
| Africans | 0.3 /100 | #261 | Tragic 61.1% |
| Barbadians | 0.2 /100 | #262 | Tragic 61.1% |
| Shoshone | 0.2 /100 | #263 | Tragic 61.1% |
| Trinidadians and Tobagonians | 0.2 /100 | #264 | Tragic 61.1% |
| Immigrants | Bahamas | 0.2 /100 | #265 | Tragic 61.1% |
| Alaskan Athabascans | 0.2 /100 | #266 | Tragic 61.0% |