Immigrants from Kuwait vs English College, Under 1 year
COMPARE
Immigrants from Kuwait
English
College, Under 1 year
College, Under 1 year Comparison
Immigrants from Kuwait
English
70.3%
COLLEGE, UNDER 1 YEAR
99.9/ 100
METRIC RATING
41st/ 347
METRIC RANK
66.6%
COLLEGE, UNDER 1 YEAR
82.9/ 100
METRIC RATING
142nd/ 347
METRIC RANK
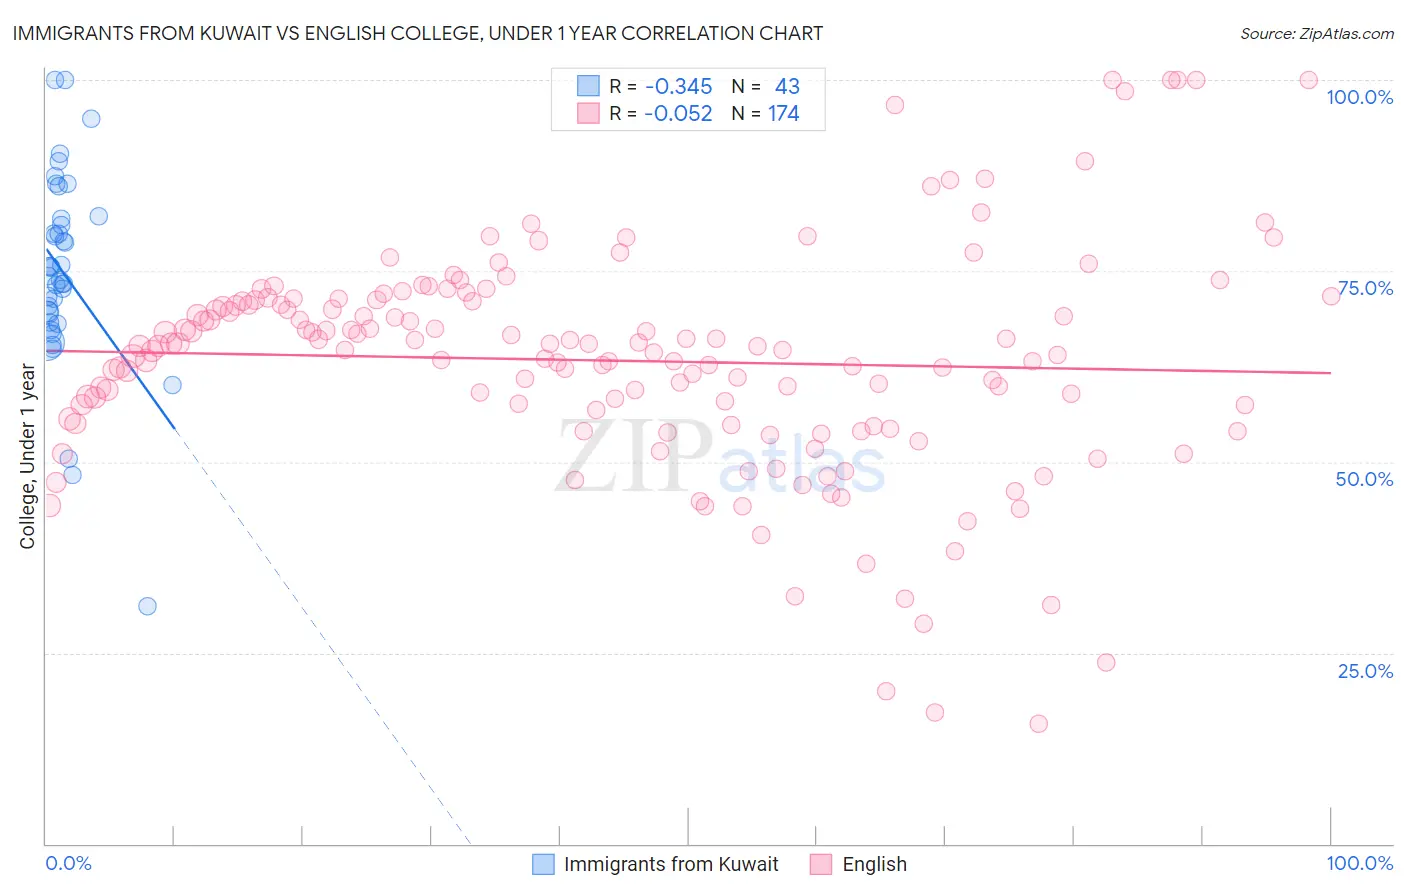
Immigrants from Kuwait vs English College, Under 1 year Correlation Chart
The statistical analysis conducted on geographies consisting of 136,917,085 people shows a mild negative correlation between the proportion of Immigrants from Kuwait and percentage of population with at least college, under 1 year education in the United States with a correlation coefficient (R) of -0.345 and weighted average of 70.3%. Similarly, the statistical analysis conducted on geographies consisting of 579,966,424 people shows a slight negative correlation between the proportion of English and percentage of population with at least college, under 1 year education in the United States with a correlation coefficient (R) of -0.052 and weighted average of 66.6%, a difference of 5.6%.
College, Under 1 year Correlation Summary
| Measurement | Immigrants from Kuwait | English |
| Minimum | 31.0% | 15.7% |
| Maximum | 100.0% | 100.0% |
| Range | 69.0% | 84.3% |
| Mean | 74.8% | 63.3% |
| Median | 74.3% | 64.9% |
| Interquartile 25% (IQ1) | 68.3% | 55.0% |
| Interquartile 75% (IQ3) | 81.8% | 71.0% |
| Interquartile Range (IQR) | 13.5% | 16.0% |
| Standard Deviation (Sample) | 12.9% | 14.9% |
| Standard Deviation (Population) | 12.7% | 14.8% |
Similar Demographics by College, Under 1 year
Demographics Similar to Immigrants from Kuwait by College, Under 1 year
In terms of college, under 1 year, the demographic groups most similar to Immigrants from Kuwait are Immigrants from Turkey (70.3%, a difference of 0.040%), Bhutanese (70.3%, a difference of 0.050%), Immigrants from Lithuania (70.3%, a difference of 0.050%), Australian (70.4%, a difference of 0.070%), and Israeli (70.2%, a difference of 0.11%).
| Demographics | Rating | Rank | College, Under 1 year |
| Estonians | 99.9 /100 | #34 | Exceptional 70.6% |
| Russians | 99.9 /100 | #35 | Exceptional 70.5% |
| Immigrants | Sri Lanka | 99.9 /100 | #36 | Exceptional 70.5% |
| Immigrants | Saudi Arabia | 99.9 /100 | #37 | Exceptional 70.4% |
| Australians | 99.9 /100 | #38 | Exceptional 70.4% |
| Bhutanese | 99.9 /100 | #39 | Exceptional 70.3% |
| Immigrants | Turkey | 99.9 /100 | #40 | Exceptional 70.3% |
| Immigrants | Kuwait | 99.9 /100 | #41 | Exceptional 70.3% |
| Immigrants | Lithuania | 99.9 /100 | #42 | Exceptional 70.3% |
| Israelis | 99.9 /100 | #43 | Exceptional 70.2% |
| New Zealanders | 99.9 /100 | #44 | Exceptional 70.2% |
| Immigrants | Norway | 99.9 /100 | #45 | Exceptional 70.2% |
| Immigrants | Latvia | 99.9 /100 | #46 | Exceptional 70.1% |
| Immigrants | Bulgaria | 99.8 /100 | #47 | Exceptional 70.0% |
| Immigrants | Netherlands | 99.8 /100 | #48 | Exceptional 70.0% |
Demographics Similar to English by College, Under 1 year
In terms of college, under 1 year, the demographic groups most similar to English are Immigrants from Uganda (66.5%, a difference of 0.010%), Immigrants from Germany (66.5%, a difference of 0.070%), Immigrants from Kenya (66.5%, a difference of 0.090%), Kenyan (66.5%, a difference of 0.090%), and Immigrants from Morocco (66.5%, a difference of 0.090%).
| Demographics | Rating | Rank | College, Under 1 year |
| Canadians | 87.9 /100 | #135 | Excellent 66.8% |
| Ugandans | 87.8 /100 | #136 | Excellent 66.8% |
| Immigrants | Chile | 87.4 /100 | #137 | Excellent 66.8% |
| Immigrants | Italy | 86.9 /100 | #138 | Excellent 66.8% |
| Venezuelans | 85.9 /100 | #139 | Excellent 66.7% |
| Slavs | 85.9 /100 | #140 | Excellent 66.7% |
| Immigrants | Afghanistan | 85.1 /100 | #141 | Excellent 66.7% |
| English | 82.9 /100 | #142 | Excellent 66.6% |
| Immigrants | Uganda | 82.8 /100 | #143 | Excellent 66.5% |
| Immigrants | Germany | 82.0 /100 | #144 | Excellent 66.5% |
| Immigrants | Kenya | 81.8 /100 | #145 | Excellent 66.5% |
| Kenyans | 81.7 /100 | #146 | Excellent 66.5% |
| Immigrants | Morocco | 81.7 /100 | #147 | Excellent 66.5% |
| Taiwanese | 78.6 /100 | #148 | Good 66.4% |
| Immigrants | Venezuela | 77.9 /100 | #149 | Good 66.3% |