Immigrants from Sweden vs English College, Under 1 year
COMPARE
Immigrants from Sweden
English
College, Under 1 year
College, Under 1 year Comparison
Immigrants from Sweden
English
72.1%
COLLEGE, UNDER 1 YEAR
100.0/ 100
METRIC RATING
12th/ 347
METRIC RANK
66.6%
COLLEGE, UNDER 1 YEAR
82.9/ 100
METRIC RATING
142nd/ 347
METRIC RANK
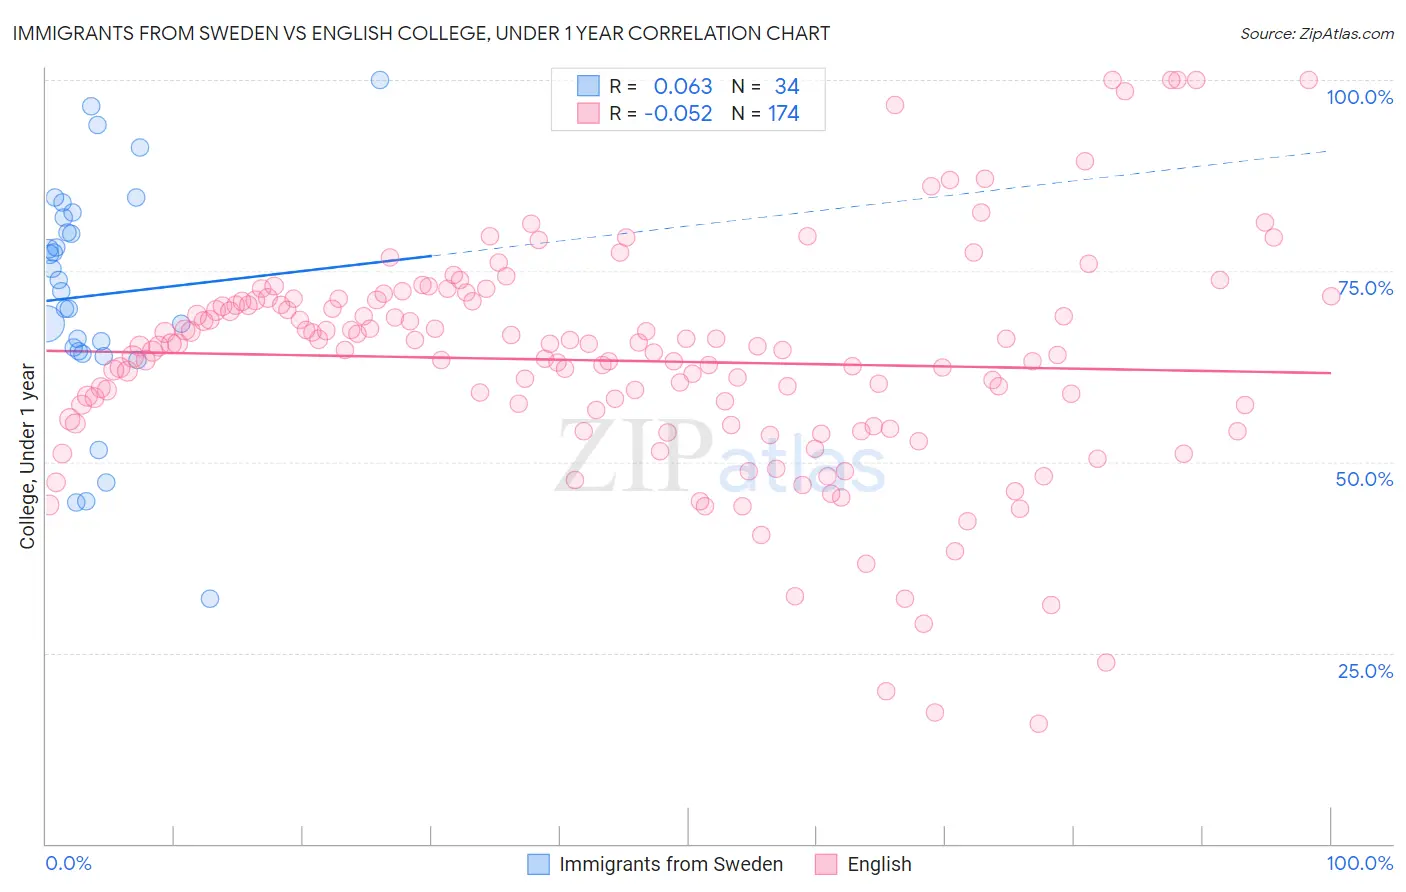
Immigrants from Sweden vs English College, Under 1 year Correlation Chart
The statistical analysis conducted on geographies consisting of 164,737,293 people shows a slight positive correlation between the proportion of Immigrants from Sweden and percentage of population with at least college, under 1 year education in the United States with a correlation coefficient (R) of 0.063 and weighted average of 72.1%. Similarly, the statistical analysis conducted on geographies consisting of 579,966,424 people shows a slight negative correlation between the proportion of English and percentage of population with at least college, under 1 year education in the United States with a correlation coefficient (R) of -0.052 and weighted average of 66.6%, a difference of 8.3%.
College, Under 1 year Correlation Summary
| Measurement | Immigrants from Sweden | English |
| Minimum | 32.0% | 15.7% |
| Maximum | 100.0% | 100.0% |
| Range | 68.0% | 84.3% |
| Mean | 71.8% | 63.3% |
| Median | 73.1% | 64.9% |
| Interquartile 25% (IQ1) | 64.5% | 55.0% |
| Interquartile 75% (IQ3) | 82.0% | 71.0% |
| Interquartile Range (IQR) | 17.4% | 16.0% |
| Standard Deviation (Sample) | 15.3% | 14.9% |
| Standard Deviation (Population) | 15.1% | 14.8% |
Similar Demographics by College, Under 1 year
Demographics Similar to Immigrants from Sweden by College, Under 1 year
In terms of college, under 1 year, the demographic groups most similar to Immigrants from Sweden are Immigrants from South Central Asia (72.1%, a difference of 0.0%), Cypriot (72.0%, a difference of 0.16%), Cambodian (71.9%, a difference of 0.27%), Burmese (71.9%, a difference of 0.28%), and Immigrants from Japan (71.9%, a difference of 0.29%).
| Demographics | Rating | Rank | College, Under 1 year |
| Immigrants | Iran | 100.0 /100 | #5 | Exceptional 74.3% |
| Immigrants | Taiwan | 100.0 /100 | #6 | Exceptional 74.2% |
| Okinawans | 100.0 /100 | #7 | Exceptional 73.7% |
| Thais | 100.0 /100 | #8 | Exceptional 73.4% |
| Immigrants | Australia | 100.0 /100 | #9 | Exceptional 72.7% |
| Immigrants | Israel | 100.0 /100 | #10 | Exceptional 72.3% |
| Immigrants | South Central Asia | 100.0 /100 | #11 | Exceptional 72.1% |
| Immigrants | Sweden | 100.0 /100 | #12 | Exceptional 72.1% |
| Cypriots | 100.0 /100 | #13 | Exceptional 72.0% |
| Cambodians | 100.0 /100 | #14 | Exceptional 71.9% |
| Burmese | 100.0 /100 | #15 | Exceptional 71.9% |
| Immigrants | Japan | 100.0 /100 | #16 | Exceptional 71.9% |
| Eastern Europeans | 100.0 /100 | #17 | Exceptional 71.8% |
| Immigrants | Switzerland | 100.0 /100 | #18 | Exceptional 71.7% |
| Latvians | 100.0 /100 | #19 | Exceptional 71.6% |
Demographics Similar to English by College, Under 1 year
In terms of college, under 1 year, the demographic groups most similar to English are Immigrants from Uganda (66.5%, a difference of 0.010%), Immigrants from Germany (66.5%, a difference of 0.070%), Immigrants from Kenya (66.5%, a difference of 0.090%), Kenyan (66.5%, a difference of 0.090%), and Immigrants from Morocco (66.5%, a difference of 0.090%).
| Demographics | Rating | Rank | College, Under 1 year |
| Canadians | 87.9 /100 | #135 | Excellent 66.8% |
| Ugandans | 87.8 /100 | #136 | Excellent 66.8% |
| Immigrants | Chile | 87.4 /100 | #137 | Excellent 66.8% |
| Immigrants | Italy | 86.9 /100 | #138 | Excellent 66.8% |
| Venezuelans | 85.9 /100 | #139 | Excellent 66.7% |
| Slavs | 85.9 /100 | #140 | Excellent 66.7% |
| Immigrants | Afghanistan | 85.1 /100 | #141 | Excellent 66.7% |
| English | 82.9 /100 | #142 | Excellent 66.6% |
| Immigrants | Uganda | 82.8 /100 | #143 | Excellent 66.5% |
| Immigrants | Germany | 82.0 /100 | #144 | Excellent 66.5% |
| Immigrants | Kenya | 81.8 /100 | #145 | Excellent 66.5% |
| Kenyans | 81.7 /100 | #146 | Excellent 66.5% |
| Immigrants | Morocco | 81.7 /100 | #147 | Excellent 66.5% |
| Taiwanese | 78.6 /100 | #148 | Good 66.4% |
| Immigrants | Venezuela | 77.9 /100 | #149 | Good 66.3% |