Immigrants from Sierra Leone vs Czechoslovakian College, Under 1 year
COMPARE
Immigrants from Sierra Leone
Czechoslovakian
College, Under 1 year
College, Under 1 year Comparison
Immigrants from Sierra Leone
Czechoslovakians
65.1%
COLLEGE, UNDER 1 YEAR
39.7/ 100
METRIC RATING
186th/ 347
METRIC RANK
65.8%
COLLEGE, UNDER 1 YEAR
62.6/ 100
METRIC RATING
164th/ 347
METRIC RANK
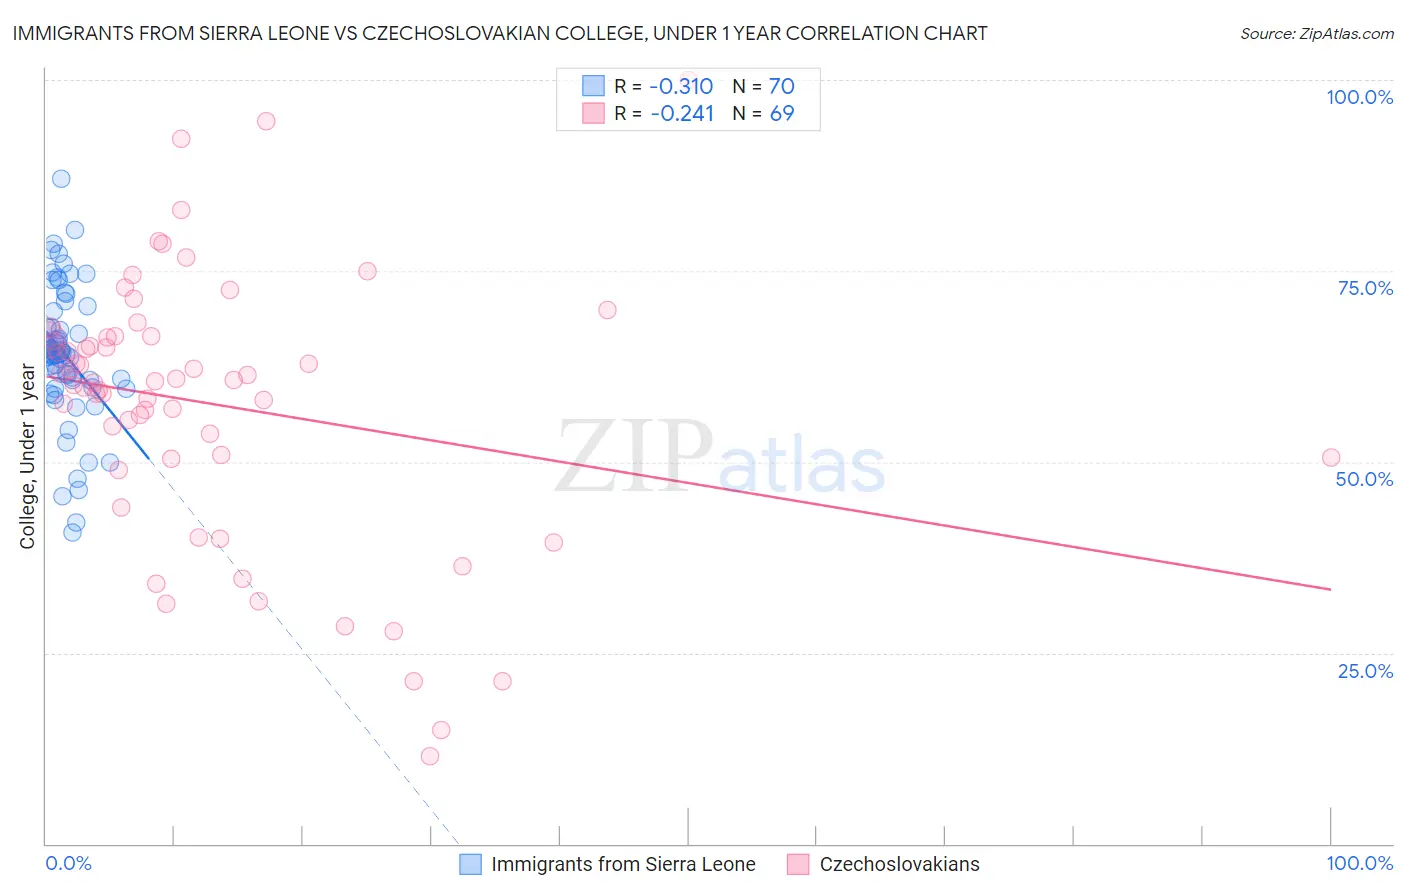
Immigrants from Sierra Leone vs Czechoslovakian College, Under 1 year Correlation Chart
The statistical analysis conducted on geographies consisting of 101,652,497 people shows a mild negative correlation between the proportion of Immigrants from Sierra Leone and percentage of population with at least college, under 1 year education in the United States with a correlation coefficient (R) of -0.310 and weighted average of 65.1%. Similarly, the statistical analysis conducted on geographies consisting of 368,667,204 people shows a weak negative correlation between the proportion of Czechoslovakians and percentage of population with at least college, under 1 year education in the United States with a correlation coefficient (R) of -0.241 and weighted average of 65.8%, a difference of 1.0%.
College, Under 1 year Correlation Summary
| Measurement | Immigrants from Sierra Leone | Czechoslovakian |
| Minimum | 40.8% | 11.5% |
| Maximum | 87.0% | 100.0% |
| Range | 46.2% | 88.5% |
| Mean | 64.1% | 57.6% |
| Median | 64.2% | 60.6% |
| Interquartile 25% (IQ1) | 60.7% | 50.4% |
| Interquartile 75% (IQ3) | 67.7% | 66.4% |
| Interquartile Range (IQR) | 7.0% | 15.9% |
| Standard Deviation (Sample) | 8.8% | 17.7% |
| Standard Deviation (Population) | 8.7% | 17.6% |
Similar Demographics by College, Under 1 year
Demographics Similar to Immigrants from Sierra Leone by College, Under 1 year
In terms of college, under 1 year, the demographic groups most similar to Immigrants from Sierra Leone are Sri Lankan (65.2%, a difference of 0.090%), Bermudan (65.2%, a difference of 0.10%), Immigrants from Poland (65.2%, a difference of 0.13%), Immigrants from Africa (65.3%, a difference of 0.23%), and Spaniard (65.3%, a difference of 0.26%).
| Demographics | Rating | Rank | College, Under 1 year |
| Guamanians/Chamorros | 48.2 /100 | #179 | Average 65.4% |
| Dutch | 46.1 /100 | #180 | Average 65.3% |
| Spaniards | 45.5 /100 | #181 | Average 65.3% |
| Immigrants | Africa | 44.7 /100 | #182 | Average 65.3% |
| Immigrants | Poland | 42.6 /100 | #183 | Average 65.2% |
| Bermudans | 42.0 /100 | #184 | Average 65.2% |
| Sri Lankans | 41.7 /100 | #185 | Average 65.2% |
| Immigrants | Sierra Leone | 39.7 /100 | #186 | Fair 65.1% |
| Immigrants | Southern Europe | 34.3 /100 | #187 | Fair 64.9% |
| Immigrants | Albania | 32.0 /100 | #188 | Fair 64.9% |
| Spanish | 31.6 /100 | #189 | Fair 64.9% |
| Immigrants | Philippines | 30.1 /100 | #190 | Fair 64.8% |
| Immigrants | Armenia | 28.1 /100 | #191 | Fair 64.7% |
| Immigrants | Thailand | 27.0 /100 | #192 | Fair 64.7% |
| Slovaks | 26.7 /100 | #193 | Fair 64.7% |
Demographics Similar to Czechoslovakians by College, Under 1 year
In terms of college, under 1 year, the demographic groups most similar to Czechoslovakians are Somali (65.8%, a difference of 0.010%), Immigrants from Uzbekistan (65.8%, a difference of 0.050%), Korean (65.9%, a difference of 0.13%), Brazilian (65.9%, a difference of 0.16%), and Albanian (65.9%, a difference of 0.17%).
| Demographics | Rating | Rank | College, Under 1 year |
| Sierra Leoneans | 67.8 /100 | #157 | Good 66.0% |
| Celtics | 67.3 /100 | #158 | Good 65.9% |
| Tlingit-Haida | 66.4 /100 | #159 | Good 65.9% |
| Albanians | 66.1 /100 | #160 | Good 65.9% |
| Brazilians | 66.0 /100 | #161 | Good 65.9% |
| Koreans | 65.3 /100 | #162 | Good 65.9% |
| Somalis | 62.7 /100 | #163 | Good 65.8% |
| Czechoslovakians | 62.6 /100 | #164 | Good 65.8% |
| Immigrants | Uzbekistan | 61.6 /100 | #165 | Good 65.8% |
| Moroccans | 56.7 /100 | #166 | Average 65.6% |
| Immigrants | Somalia | 56.4 /100 | #167 | Average 65.6% |
| Hungarians | 55.9 /100 | #168 | Average 65.6% |
| Yugoslavians | 55.7 /100 | #169 | Average 65.6% |
| Germans | 55.7 /100 | #170 | Average 65.6% |
| Immigrants | Oceania | 55.0 /100 | #171 | Average 65.6% |