Immigrants from Armenia vs Czechoslovakian College, Under 1 year
COMPARE
Immigrants from Armenia
Czechoslovakian
College, Under 1 year
College, Under 1 year Comparison
Immigrants from Armenia
Czechoslovakians
64.7%
COLLEGE, UNDER 1 YEAR
28.1/ 100
METRIC RATING
191st/ 347
METRIC RANK
65.8%
COLLEGE, UNDER 1 YEAR
62.6/ 100
METRIC RATING
164th/ 347
METRIC RANK
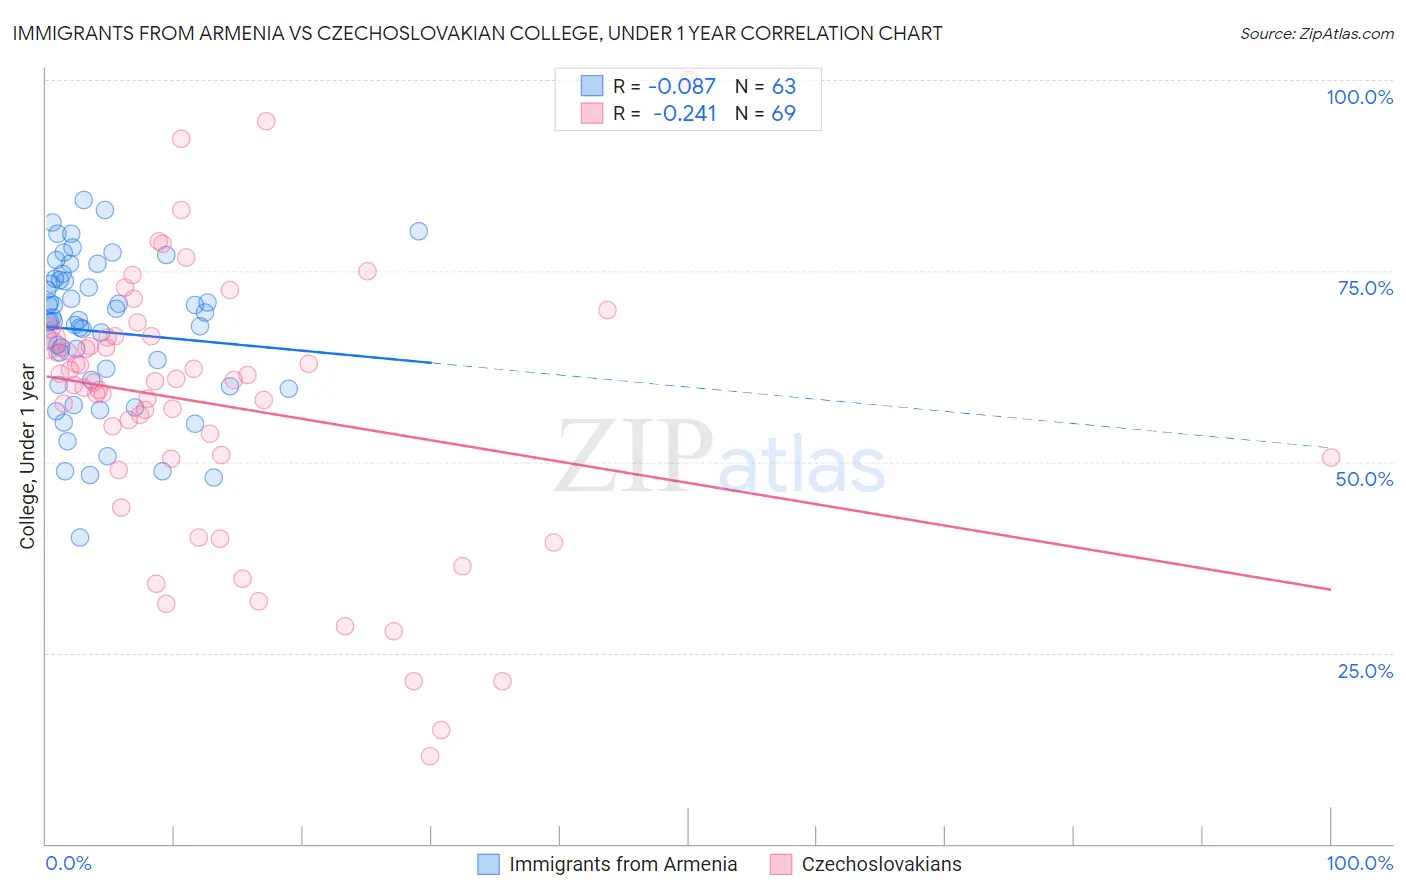
Immigrants from Armenia vs Czechoslovakian College, Under 1 year Correlation Chart
The statistical analysis conducted on geographies consisting of 97,725,183 people shows a slight negative correlation between the proportion of Immigrants from Armenia and percentage of population with at least college, under 1 year education in the United States with a correlation coefficient (R) of -0.087 and weighted average of 64.7%. Similarly, the statistical analysis conducted on geographies consisting of 368,667,204 people shows a weak negative correlation between the proportion of Czechoslovakians and percentage of population with at least college, under 1 year education in the United States with a correlation coefficient (R) of -0.241 and weighted average of 65.8%, a difference of 1.6%.
College, Under 1 year Correlation Summary
| Measurement | Immigrants from Armenia | Czechoslovakian |
| Minimum | 40.2% | 11.5% |
| Maximum | 84.3% | 100.0% |
| Range | 44.1% | 88.5% |
| Mean | 67.0% | 57.6% |
| Median | 68.4% | 60.6% |
| Interquartile 25% (IQ1) | 60.1% | 50.4% |
| Interquartile 75% (IQ3) | 73.8% | 66.4% |
| Interquartile Range (IQR) | 13.6% | 15.9% |
| Standard Deviation (Sample) | 9.7% | 17.7% |
| Standard Deviation (Population) | 9.7% | 17.6% |
Similar Demographics by College, Under 1 year
Demographics Similar to Immigrants from Armenia by College, Under 1 year
In terms of college, under 1 year, the demographic groups most similar to Immigrants from Armenia are Immigrants from Thailand (64.7%, a difference of 0.060%), Slovak (64.7%, a difference of 0.070%), Immigrants from Philippines (64.8%, a difference of 0.11%), Spanish (64.9%, a difference of 0.19%), and Immigrants from Cameroon (64.6%, a difference of 0.20%).
| Demographics | Rating | Rank | College, Under 1 year |
| Bermudans | 42.0 /100 | #184 | Average 65.2% |
| Sri Lankans | 41.7 /100 | #185 | Average 65.2% |
| Immigrants | Sierra Leone | 39.7 /100 | #186 | Fair 65.1% |
| Immigrants | Southern Europe | 34.3 /100 | #187 | Fair 64.9% |
| Immigrants | Albania | 32.0 /100 | #188 | Fair 64.9% |
| Spanish | 31.6 /100 | #189 | Fair 64.9% |
| Immigrants | Philippines | 30.1 /100 | #190 | Fair 64.8% |
| Immigrants | Armenia | 28.1 /100 | #191 | Fair 64.7% |
| Immigrants | Thailand | 27.0 /100 | #192 | Fair 64.7% |
| Slovaks | 26.7 /100 | #193 | Fair 64.7% |
| Immigrants | Cameroon | 24.6 /100 | #194 | Fair 64.6% |
| Immigrants | South Eastern Asia | 22.1 /100 | #195 | Fair 64.5% |
| Tongans | 21.2 /100 | #196 | Fair 64.5% |
| Costa Ricans | 19.6 /100 | #197 | Poor 64.4% |
| Tsimshian | 17.9 /100 | #198 | Poor 64.3% |
Demographics Similar to Czechoslovakians by College, Under 1 year
In terms of college, under 1 year, the demographic groups most similar to Czechoslovakians are Somali (65.8%, a difference of 0.010%), Immigrants from Uzbekistan (65.8%, a difference of 0.050%), Korean (65.9%, a difference of 0.13%), Brazilian (65.9%, a difference of 0.16%), and Albanian (65.9%, a difference of 0.17%).
| Demographics | Rating | Rank | College, Under 1 year |
| Sierra Leoneans | 67.8 /100 | #157 | Good 66.0% |
| Celtics | 67.3 /100 | #158 | Good 65.9% |
| Tlingit-Haida | 66.4 /100 | #159 | Good 65.9% |
| Albanians | 66.1 /100 | #160 | Good 65.9% |
| Brazilians | 66.0 /100 | #161 | Good 65.9% |
| Koreans | 65.3 /100 | #162 | Good 65.9% |
| Somalis | 62.7 /100 | #163 | Good 65.8% |
| Czechoslovakians | 62.6 /100 | #164 | Good 65.8% |
| Immigrants | Uzbekistan | 61.6 /100 | #165 | Good 65.8% |
| Moroccans | 56.7 /100 | #166 | Average 65.6% |
| Immigrants | Somalia | 56.4 /100 | #167 | Average 65.6% |
| Hungarians | 55.9 /100 | #168 | Average 65.6% |
| Yugoslavians | 55.7 /100 | #169 | Average 65.6% |
| Germans | 55.7 /100 | #170 | Average 65.6% |
| Immigrants | Oceania | 55.0 /100 | #171 | Average 65.6% |