Celtic vs Immigrants from Portugal High School Diploma
COMPARE
Celtic
Immigrants from Portugal
High School Diploma
High School Diploma Comparison
Celtics
Immigrants from Portugal
90.6%
HIGH SCHOOL DIPLOMA
98.7/ 100
METRIC RATING
90th/ 347
METRIC RANK
85.3%
HIGH SCHOOL DIPLOMA
0.0/ 100
METRIC RATING
305th/ 347
METRIC RANK
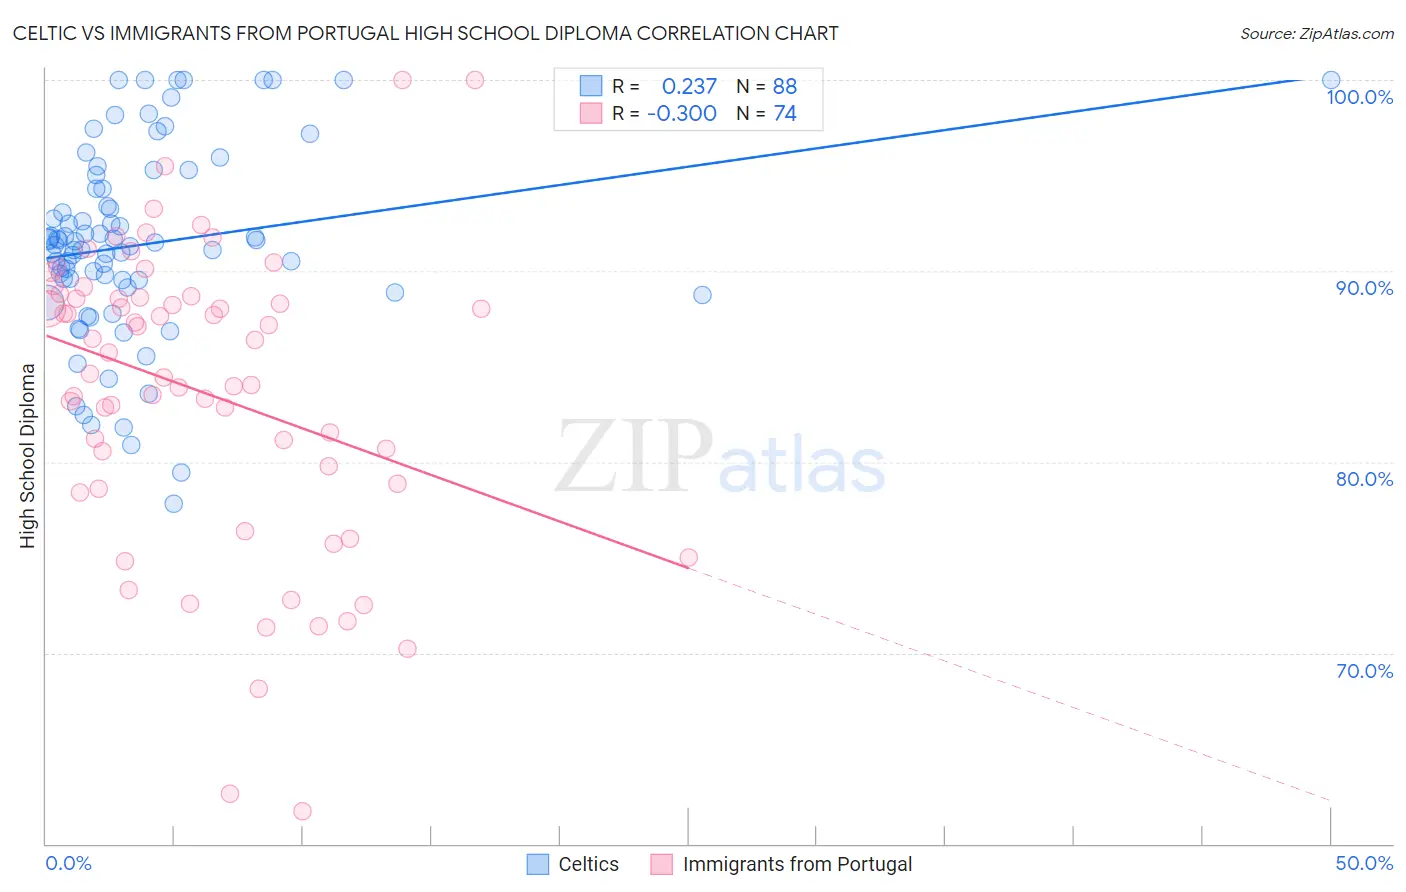
Celtic vs Immigrants from Portugal High School Diploma Correlation Chart
The statistical analysis conducted on geographies consisting of 168,876,981 people shows a weak positive correlation between the proportion of Celtics and percentage of population with at least high school diploma education in the United States with a correlation coefficient (R) of 0.237 and weighted average of 90.6%. Similarly, the statistical analysis conducted on geographies consisting of 174,792,669 people shows a mild negative correlation between the proportion of Immigrants from Portugal and percentage of population with at least high school diploma education in the United States with a correlation coefficient (R) of -0.300 and weighted average of 85.3%, a difference of 6.2%.
High School Diploma Correlation Summary
| Measurement | Celtic | Immigrants from Portugal |
| Minimum | 77.8% | 61.7% |
| Maximum | 100.0% | 100.0% |
| Range | 22.2% | 38.3% |
| Mean | 91.4% | 83.7% |
| Median | 91.4% | 85.2% |
| Interquartile 25% (IQ1) | 89.3% | 78.9% |
| Interquartile 75% (IQ3) | 94.3% | 88.6% |
| Interquartile Range (IQR) | 5.0% | 9.8% |
| Standard Deviation (Sample) | 5.0% | 7.8% |
| Standard Deviation (Population) | 5.0% | 7.8% |
Similar Demographics by High School Diploma
Demographics Similar to Celtics by High School Diploma
In terms of high school diploma, the demographic groups most similar to Celtics are Canadian (90.6%, a difference of 0.010%), South African (90.6%, a difference of 0.020%), Immigrants from France (90.6%, a difference of 0.030%), Swiss (90.6%, a difference of 0.030%), and Immigrants from Western Europe (90.6%, a difference of 0.040%).
| Demographics | Rating | Rank | High School Diploma |
| Immigrants | Moldova | 99.2 /100 | #83 | Exceptional 90.7% |
| Immigrants | Saudi Arabia | 99.1 /100 | #84 | Exceptional 90.7% |
| Romanians | 98.9 /100 | #85 | Exceptional 90.7% |
| Immigrants | Bulgaria | 98.9 /100 | #86 | Exceptional 90.6% |
| Immigrants | Turkey | 98.9 /100 | #87 | Exceptional 90.6% |
| Immigrants | France | 98.8 /100 | #88 | Exceptional 90.6% |
| Canadians | 98.7 /100 | #89 | Exceptional 90.6% |
| Celtics | 98.7 /100 | #90 | Exceptional 90.6% |
| South Africans | 98.6 /100 | #91 | Exceptional 90.6% |
| Swiss | 98.6 /100 | #92 | Exceptional 90.6% |
| Immigrants | Western Europe | 98.6 /100 | #93 | Exceptional 90.6% |
| Immigrants | Israel | 98.5 /100 | #94 | Exceptional 90.5% |
| Icelanders | 98.5 /100 | #95 | Exceptional 90.5% |
| Immigrants | Serbia | 98.4 /100 | #96 | Exceptional 90.5% |
| Immigrants | Kuwait | 98.3 /100 | #97 | Exceptional 90.5% |
Demographics Similar to Immigrants from Portugal by High School Diploma
In terms of high school diploma, the demographic groups most similar to Immigrants from Portugal are Nepalese (85.3%, a difference of 0.010%), Immigrants from Guyana (85.3%, a difference of 0.050%), Immigrants from Haiti (85.4%, a difference of 0.11%), Cuban (85.4%, a difference of 0.11%), and Navajo (85.2%, a difference of 0.14%).
| Demographics | Rating | Rank | High School Diploma |
| Natives/Alaskans | 0.0 /100 | #298 | Tragic 85.6% |
| Guyanese | 0.0 /100 | #299 | Tragic 85.5% |
| Immigrants | Bangladesh | 0.0 /100 | #300 | Tragic 85.5% |
| Vietnamese | 0.0 /100 | #301 | Tragic 85.4% |
| Immigrants | Haiti | 0.0 /100 | #302 | Tragic 85.4% |
| Cubans | 0.0 /100 | #303 | Tragic 85.4% |
| Nepalese | 0.0 /100 | #304 | Tragic 85.3% |
| Immigrants | Portugal | 0.0 /100 | #305 | Tragic 85.3% |
| Immigrants | Guyana | 0.0 /100 | #306 | Tragic 85.3% |
| Navajo | 0.0 /100 | #307 | Tragic 85.2% |
| Immigrants | Armenia | 0.0 /100 | #308 | Tragic 85.2% |
| Immigrants | Dominica | 0.0 /100 | #309 | Tragic 85.2% |
| Apache | 0.0 /100 | #310 | Tragic 85.1% |
| Ecuadorians | 0.0 /100 | #311 | Tragic 85.1% |
| Cape Verdeans | 0.0 /100 | #312 | Tragic 85.1% |