Celtic vs Chippewa Bachelor's Degree
COMPARE
Celtic
Chippewa
Bachelor's Degree
Bachelor's Degree Comparison
Celtics
Chippewa
37.0%
BACHELOR'S DEGREE
29.5/ 100
METRIC RATING
196th/ 347
METRIC RANK
30.6%
BACHELOR'S DEGREE
0.0/ 100
METRIC RATING
298th/ 347
METRIC RANK
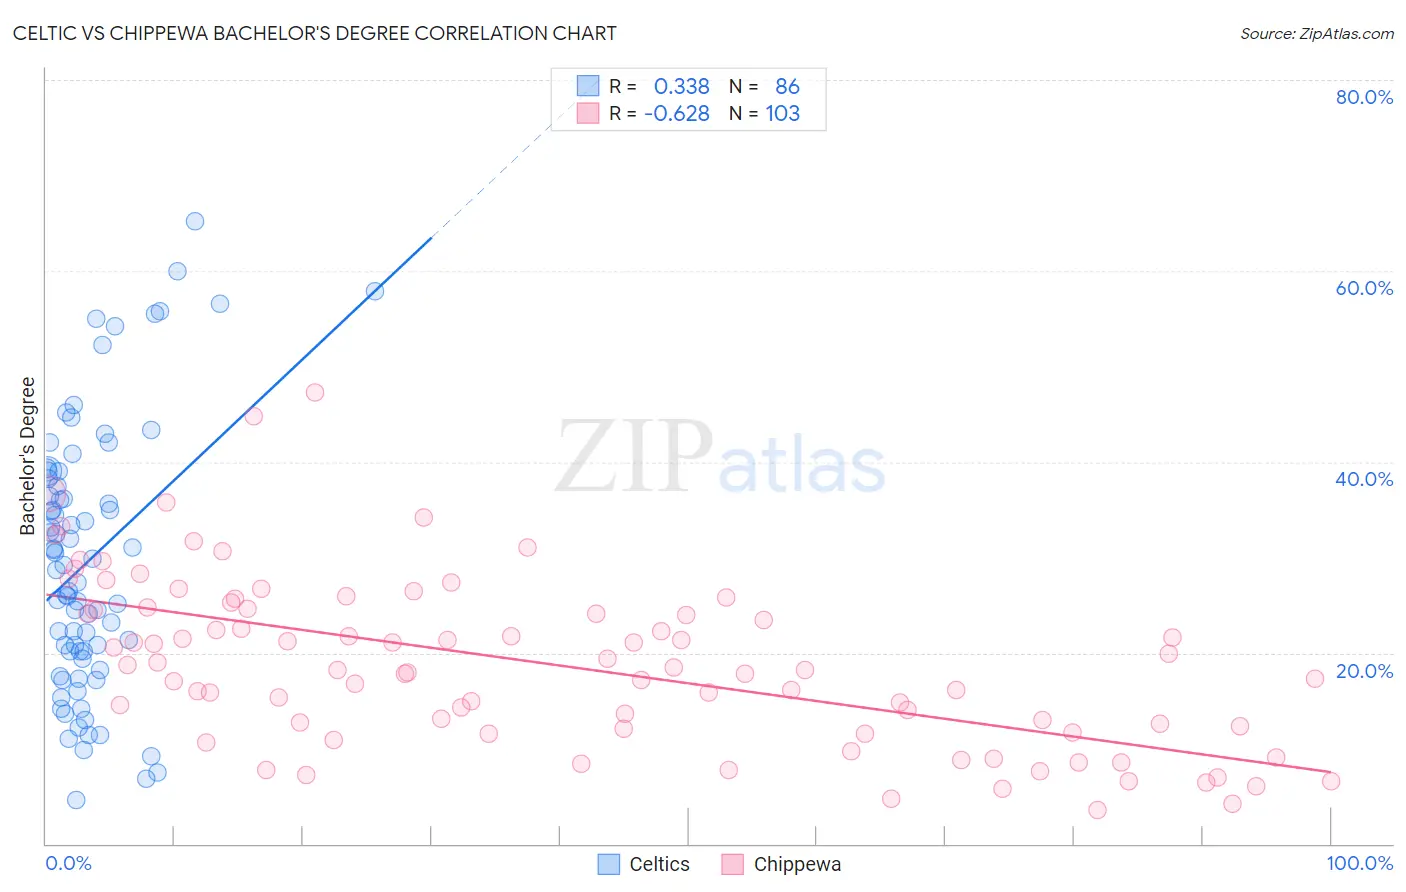
Celtic vs Chippewa Bachelor's Degree Correlation Chart
The statistical analysis conducted on geographies consisting of 168,877,213 people shows a mild positive correlation between the proportion of Celtics and percentage of population with at least bachelor's degree education in the United States with a correlation coefficient (R) of 0.338 and weighted average of 37.0%. Similarly, the statistical analysis conducted on geographies consisting of 215,055,774 people shows a significant negative correlation between the proportion of Chippewa and percentage of population with at least bachelor's degree education in the United States with a correlation coefficient (R) of -0.628 and weighted average of 30.6%, a difference of 21.2%.
Bachelor's Degree Correlation Summary
| Measurement | Celtic | Chippewa |
| Minimum | 4.5% | 3.6% |
| Maximum | 65.3% | 47.3% |
| Range | 60.7% | 43.7% |
| Mean | 29.6% | 18.8% |
| Median | 28.9% | 18.2% |
| Interquartile 25% (IQ1) | 20.1% | 12.0% |
| Interquartile 75% (IQ3) | 38.2% | 24.6% |
| Interquartile Range (IQR) | 18.1% | 12.6% |
| Standard Deviation (Sample) | 13.8% | 8.9% |
| Standard Deviation (Population) | 13.7% | 8.8% |
Similar Demographics by Bachelor's Degree
Demographics Similar to Celtics by Bachelor's Degree
In terms of bachelor's degree, the demographic groups most similar to Celtics are Korean (37.0%, a difference of 0.030%), Belgian (37.0%, a difference of 0.040%), Czechoslovakian (37.0%, a difference of 0.040%), Welsh (37.0%, a difference of 0.050%), and Yugoslavian (37.1%, a difference of 0.23%).
| Demographics | Rating | Rank | Bachelor's Degree |
| Slovaks | 36.9 /100 | #189 | Fair 37.3% |
| Swiss | 34.1 /100 | #190 | Fair 37.2% |
| Nigerians | 33.9 /100 | #191 | Fair 37.2% |
| Immigrants | Vietnam | 32.1 /100 | #192 | Fair 37.1% |
| Yugoslavians | 31.5 /100 | #193 | Fair 37.1% |
| Belgians | 29.9 /100 | #194 | Fair 37.0% |
| Koreans | 29.8 /100 | #195 | Fair 37.0% |
| Celtics | 29.5 /100 | #196 | Fair 37.0% |
| Czechoslovakians | 29.2 /100 | #197 | Fair 37.0% |
| Welsh | 29.1 /100 | #198 | Fair 37.0% |
| Immigrants | Costa Rica | 27.4 /100 | #199 | Fair 36.9% |
| Immigrants | Ghana | 27.4 /100 | #200 | Fair 36.9% |
| Immigrants | South Eastern Asia | 25.4 /100 | #201 | Fair 36.8% |
| Immigrants | Zaire | 25.3 /100 | #202 | Fair 36.8% |
| Immigrants | Nigeria | 23.1 /100 | #203 | Fair 36.7% |
Demographics Similar to Chippewa by Bachelor's Degree
In terms of bachelor's degree, the demographic groups most similar to Chippewa are Immigrants from Haiti (30.6%, a difference of 0.25%), Puget Sound Salish (30.7%, a difference of 0.31%), Immigrants from Dominican Republic (30.7%, a difference of 0.41%), Chickasaw (30.4%, a difference of 0.52%), and Immigrants from Micronesia (30.4%, a difference of 0.54%).
| Demographics | Rating | Rank | Bachelor's Degree |
| Blacks/African Americans | 0.1 /100 | #291 | Tragic 30.9% |
| Ute | 0.1 /100 | #292 | Tragic 30.9% |
| Cape Verdeans | 0.1 /100 | #293 | Tragic 30.9% |
| Immigrants | Guatemala | 0.0 /100 | #294 | Tragic 30.8% |
| Immigrants | Dominican Republic | 0.0 /100 | #295 | Tragic 30.7% |
| Puget Sound Salish | 0.0 /100 | #296 | Tragic 30.7% |
| Immigrants | Haiti | 0.0 /100 | #297 | Tragic 30.6% |
| Chippewa | 0.0 /100 | #298 | Tragic 30.6% |
| Chickasaw | 0.0 /100 | #299 | Tragic 30.4% |
| Immigrants | Micronesia | 0.0 /100 | #300 | Tragic 30.4% |
| Immigrants | Cuba | 0.0 /100 | #301 | Tragic 30.3% |
| Mexican American Indians | 0.0 /100 | #302 | Tragic 30.2% |
| Bangladeshis | 0.0 /100 | #303 | Tragic 30.2% |
| Cherokee | 0.0 /100 | #304 | Tragic 30.2% |
| Immigrants | Latin America | 0.0 /100 | #305 | Tragic 30.1% |