Celtic vs U.S. Virgin Islander Bachelor's Degree
COMPARE
Celtic
U.S. Virgin Islander
Bachelor's Degree
Bachelor's Degree Comparison
Celtics
U.S. Virgin Islanders
37.0%
BACHELOR'S DEGREE
29.5/ 100
METRIC RATING
196th/ 347
METRIC RANK
33.2%
BACHELOR'S DEGREE
0.7/ 100
METRIC RATING
253rd/ 347
METRIC RANK
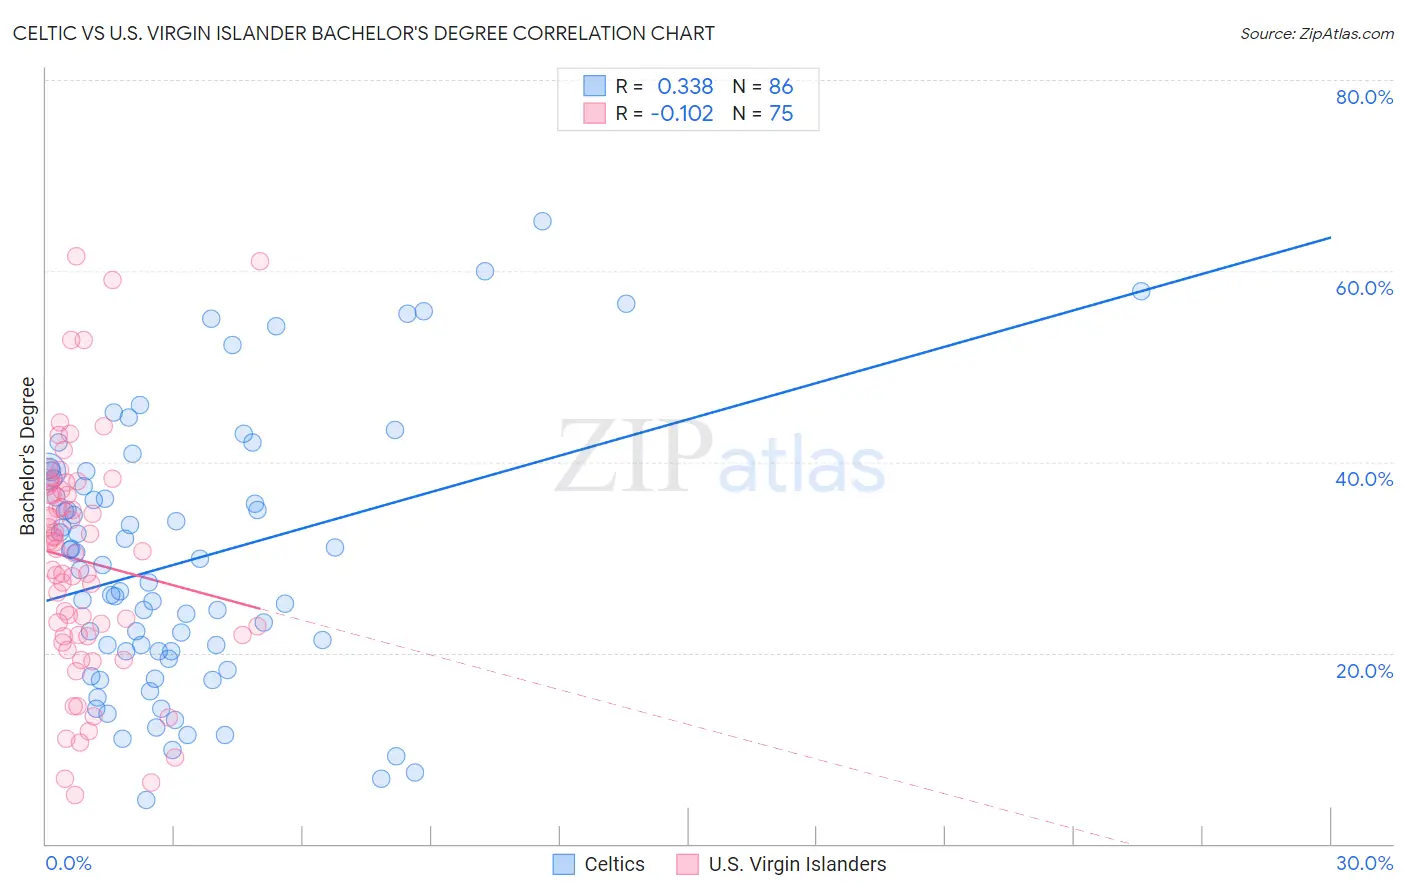
Celtic vs U.S. Virgin Islander Bachelor's Degree Correlation Chart
The statistical analysis conducted on geographies consisting of 168,877,213 people shows a mild positive correlation between the proportion of Celtics and percentage of population with at least bachelor's degree education in the United States with a correlation coefficient (R) of 0.338 and weighted average of 37.0%. Similarly, the statistical analysis conducted on geographies consisting of 87,527,119 people shows a poor negative correlation between the proportion of U.S. Virgin Islanders and percentage of population with at least bachelor's degree education in the United States with a correlation coefficient (R) of -0.102 and weighted average of 33.2%, a difference of 11.4%.
Bachelor's Degree Correlation Summary
| Measurement | Celtic | U.S. Virgin Islander |
| Minimum | 4.5% | 5.1% |
| Maximum | 65.3% | 61.5% |
| Range | 60.7% | 56.4% |
| Mean | 29.6% | 29.6% |
| Median | 28.9% | 30.7% |
| Interquartile 25% (IQ1) | 20.1% | 21.7% |
| Interquartile 75% (IQ3) | 38.2% | 37.1% |
| Interquartile Range (IQR) | 18.1% | 15.4% |
| Standard Deviation (Sample) | 13.8% | 12.3% |
| Standard Deviation (Population) | 13.7% | 12.2% |
Similar Demographics by Bachelor's Degree
Demographics Similar to Celtics by Bachelor's Degree
In terms of bachelor's degree, the demographic groups most similar to Celtics are Korean (37.0%, a difference of 0.030%), Belgian (37.0%, a difference of 0.040%), Czechoslovakian (37.0%, a difference of 0.040%), Welsh (37.0%, a difference of 0.050%), and Yugoslavian (37.1%, a difference of 0.23%).
| Demographics | Rating | Rank | Bachelor's Degree |
| Slovaks | 36.9 /100 | #189 | Fair 37.3% |
| Swiss | 34.1 /100 | #190 | Fair 37.2% |
| Nigerians | 33.9 /100 | #191 | Fair 37.2% |
| Immigrants | Vietnam | 32.1 /100 | #192 | Fair 37.1% |
| Yugoslavians | 31.5 /100 | #193 | Fair 37.1% |
| Belgians | 29.9 /100 | #194 | Fair 37.0% |
| Koreans | 29.8 /100 | #195 | Fair 37.0% |
| Celtics | 29.5 /100 | #196 | Fair 37.0% |
| Czechoslovakians | 29.2 /100 | #197 | Fair 37.0% |
| Welsh | 29.1 /100 | #198 | Fair 37.0% |
| Immigrants | Costa Rica | 27.4 /100 | #199 | Fair 36.9% |
| Immigrants | Ghana | 27.4 /100 | #200 | Fair 36.9% |
| Immigrants | South Eastern Asia | 25.4 /100 | #201 | Fair 36.8% |
| Immigrants | Zaire | 25.3 /100 | #202 | Fair 36.8% |
| Immigrants | Nigeria | 23.1 /100 | #203 | Fair 36.7% |
Demographics Similar to U.S. Virgin Islanders by Bachelor's Degree
In terms of bachelor's degree, the demographic groups most similar to U.S. Virgin Islanders are Native Hawaiian (33.2%, a difference of 0.060%), Iroquois (33.2%, a difference of 0.080%), Immigrants from Bahamas (33.3%, a difference of 0.21%), Nicaraguan (33.1%, a difference of 0.27%), and Japanese (33.3%, a difference of 0.28%).
| Demographics | Rating | Rank | Bachelor's Degree |
| Jamaicans | 1.0 /100 | #246 | Tragic 33.6% |
| Immigrants | Congo | 1.0 /100 | #247 | Tragic 33.6% |
| Cree | 1.0 /100 | #248 | Tragic 33.6% |
| Immigrants | Liberia | 0.9 /100 | #249 | Tragic 33.5% |
| Indonesians | 0.9 /100 | #250 | Tragic 33.5% |
| Japanese | 0.7 /100 | #251 | Tragic 33.3% |
| Immigrants | Bahamas | 0.7 /100 | #252 | Tragic 33.3% |
| U.S. Virgin Islanders | 0.7 /100 | #253 | Tragic 33.2% |
| Native Hawaiians | 0.7 /100 | #254 | Tragic 33.2% |
| Iroquois | 0.7 /100 | #255 | Tragic 33.2% |
| Nicaraguans | 0.6 /100 | #256 | Tragic 33.1% |
| Spanish Americans | 0.6 /100 | #257 | Tragic 33.1% |
| French American Indians | 0.6 /100 | #258 | Tragic 33.1% |
| Osage | 0.5 /100 | #259 | Tragic 33.0% |
| Malaysians | 0.5 /100 | #260 | Tragic 32.9% |