Celtic vs Immigrants from Western Africa Bachelor's Degree
COMPARE
Celtic
Immigrants from Western Africa
Bachelor's Degree
Bachelor's Degree Comparison
Celtics
Immigrants from Western Africa
37.0%
BACHELOR'S DEGREE
29.5/ 100
METRIC RATING
196th/ 347
METRIC RANK
36.1%
BACHELOR'S DEGREE
13.8/ 100
METRIC RATING
215th/ 347
METRIC RANK
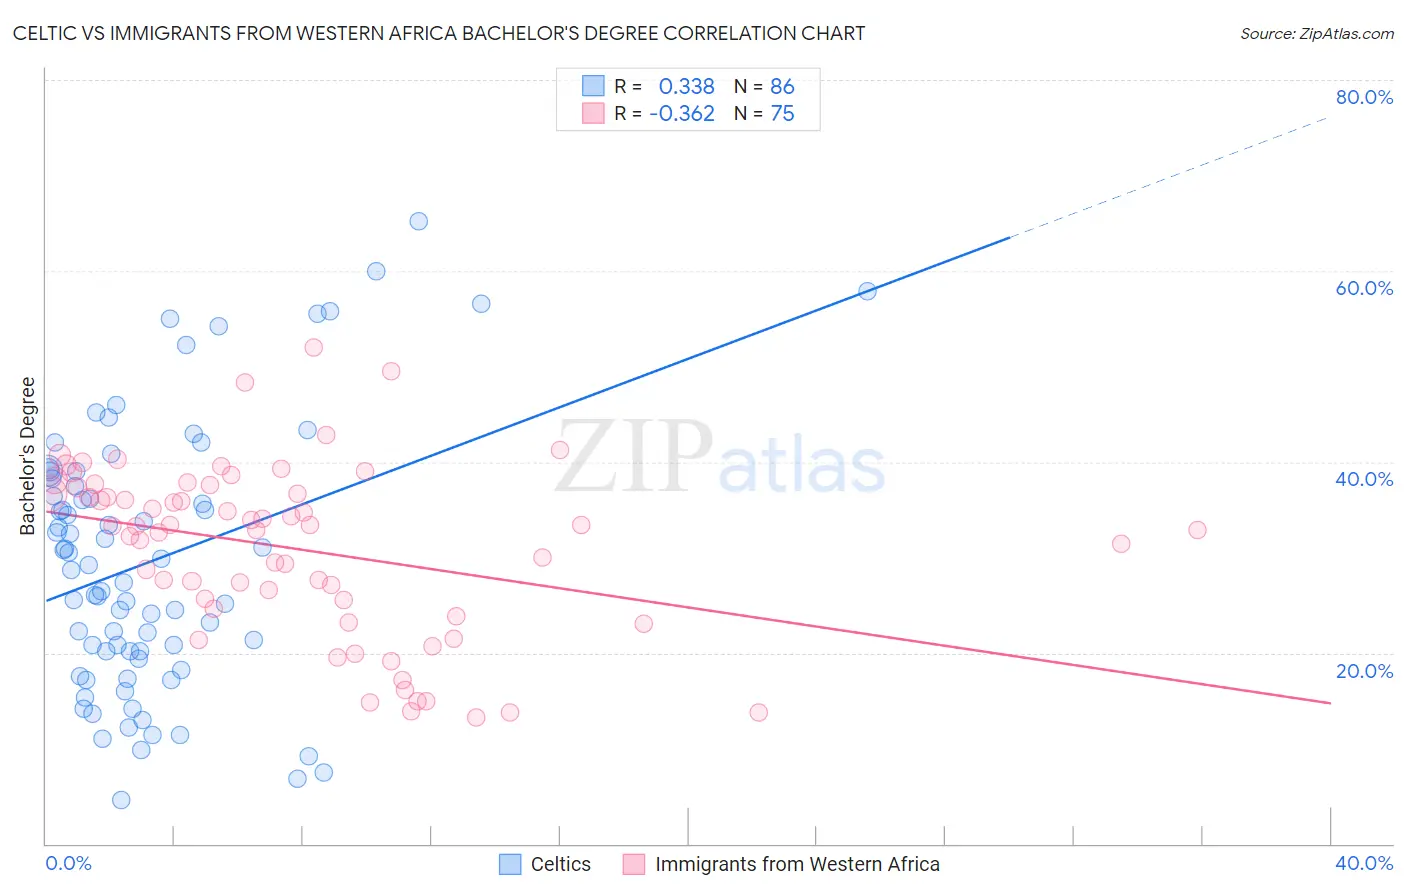
Celtic vs Immigrants from Western Africa Bachelor's Degree Correlation Chart
The statistical analysis conducted on geographies consisting of 168,877,213 people shows a mild positive correlation between the proportion of Celtics and percentage of population with at least bachelor's degree education in the United States with a correlation coefficient (R) of 0.338 and weighted average of 37.0%. Similarly, the statistical analysis conducted on geographies consisting of 357,836,949 people shows a mild negative correlation between the proportion of Immigrants from Western Africa and percentage of population with at least bachelor's degree education in the United States with a correlation coefficient (R) of -0.362 and weighted average of 36.1%, a difference of 2.5%.
Bachelor's Degree Correlation Summary
| Measurement | Celtic | Immigrants from Western Africa |
| Minimum | 4.5% | 13.3% |
| Maximum | 65.3% | 52.0% |
| Range | 60.7% | 38.8% |
| Mean | 29.6% | 30.9% |
| Median | 28.9% | 33.2% |
| Interquartile 25% (IQ1) | 20.1% | 24.6% |
| Interquartile 75% (IQ3) | 38.2% | 37.3% |
| Interquartile Range (IQR) | 18.1% | 12.6% |
| Standard Deviation (Sample) | 13.8% | 9.0% |
| Standard Deviation (Population) | 13.7% | 8.9% |
Demographics Similar to Celtics and Immigrants from Western Africa by Bachelor's Degree
In terms of bachelor's degree, the demographic groups most similar to Celtics are Korean (37.0%, a difference of 0.030%), Czechoslovakian (37.0%, a difference of 0.040%), Welsh (37.0%, a difference of 0.050%), Immigrants from Costa Rica (36.9%, a difference of 0.26%), and Immigrants from Ghana (36.9%, a difference of 0.27%). Similarly, the demographic groups most similar to Immigrants from Western Africa are German (36.1%, a difference of 0.030%), Immigrants from Panama (36.2%, a difference of 0.10%), Immigrants from Philippines (36.4%, a difference of 0.78%), Scotch-Irish (36.4%, a difference of 0.86%), and French (36.5%, a difference of 0.91%).
| Demographics | Rating | Rank | Bachelor's Degree |
| Koreans | 29.8 /100 | #195 | Fair 37.0% |
| Celtics | 29.5 /100 | #196 | Fair 37.0% |
| Czechoslovakians | 29.2 /100 | #197 | Fair 37.0% |
| Welsh | 29.1 /100 | #198 | Fair 37.0% |
| Immigrants | Costa Rica | 27.4 /100 | #199 | Fair 36.9% |
| Immigrants | Ghana | 27.4 /100 | #200 | Fair 36.9% |
| Immigrants | South Eastern Asia | 25.4 /100 | #201 | Fair 36.8% |
| Immigrants | Zaire | 25.3 /100 | #202 | Fair 36.8% |
| Immigrants | Nigeria | 23.1 /100 | #203 | Fair 36.7% |
| Immigrants | Immigrants | 22.8 /100 | #204 | Fair 36.7% |
| Finns | 22.2 /100 | #205 | Fair 36.7% |
| Spaniards | 21.2 /100 | #206 | Fair 36.6% |
| Immigrants | Middle Africa | 20.6 /100 | #207 | Fair 36.6% |
| Immigrants | Thailand | 19.4 /100 | #208 | Poor 36.5% |
| Panamanians | 18.8 /100 | #209 | Poor 36.5% |
| French | 18.6 /100 | #210 | Poor 36.5% |
| Scotch-Irish | 18.3 /100 | #211 | Poor 36.4% |
| Immigrants | Philippines | 17.8 /100 | #212 | Poor 36.4% |
| Immigrants | Panama | 14.2 /100 | #213 | Poor 36.2% |
| Germans | 13.9 /100 | #214 | Poor 36.1% |
| Immigrants | Western Africa | 13.8 /100 | #215 | Poor 36.1% |