Canadian vs Immigrants from Grenada Female Poverty Among 18-24 Year Olds
COMPARE
Canadian
Immigrants from Grenada
Female Poverty Among 18-24 Year Olds
Female Poverty Among 18-24 Year Olds Comparison
Canadians
Immigrants from Grenada
19.7%
FEMALE POVERTY AMONG 18-24 YEAR OLDS
83.8/ 100
METRIC RATING
145th/ 347
METRIC RANK
21.2%
FEMALE POVERTY AMONG 18-24 YEAR OLDS
1.2/ 100
METRIC RATING
255th/ 347
METRIC RANK
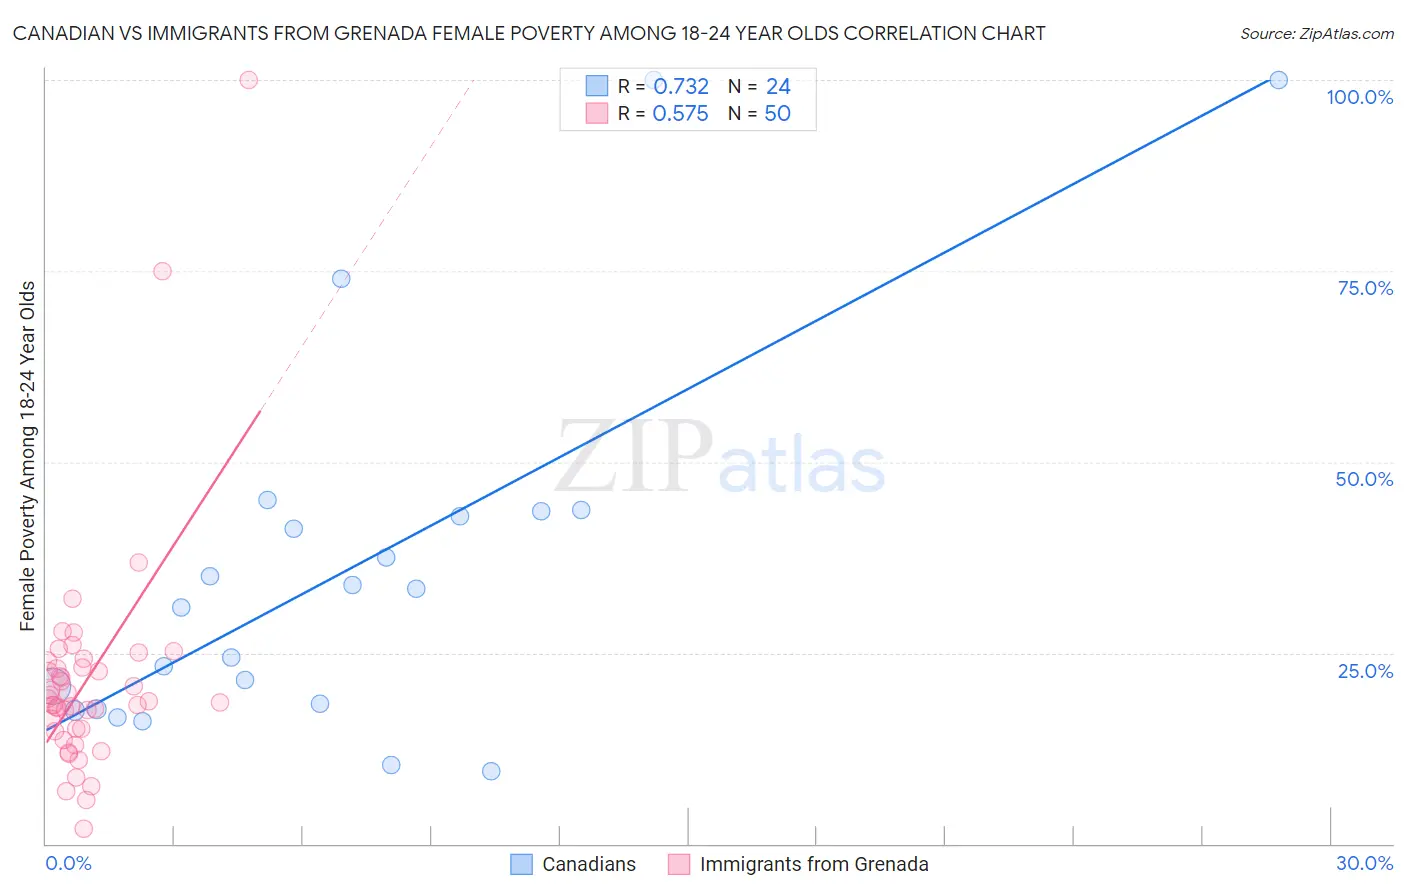
Canadian vs Immigrants from Grenada Female Poverty Among 18-24 Year Olds Correlation Chart
The statistical analysis conducted on geographies consisting of 422,696,496 people shows a strong positive correlation between the proportion of Canadians and poverty level among females between the ages 18 and 24 in the United States with a correlation coefficient (R) of 0.732 and weighted average of 19.7%. Similarly, the statistical analysis conducted on geographies consisting of 66,763,632 people shows a substantial positive correlation between the proportion of Immigrants from Grenada and poverty level among females between the ages 18 and 24 in the United States with a correlation coefficient (R) of 0.575 and weighted average of 21.2%, a difference of 7.6%.
Female Poverty Among 18-24 Year Olds Correlation Summary
| Measurement | Canadian | Immigrants from Grenada |
| Minimum | 9.5% | 2.0% |
| Maximum | 100.0% | 100.0% |
| Range | 90.5% | 98.0% |
| Mean | 35.7% | 21.4% |
| Median | 32.2% | 18.6% |
| Interquartile 25% (IQ1) | 17.9% | 15.0% |
| Interquartile 75% (IQ3) | 43.2% | 23.1% |
| Interquartile Range (IQR) | 25.3% | 8.1% |
| Standard Deviation (Sample) | 24.5% | 15.4% |
| Standard Deviation (Population) | 24.0% | 15.2% |
Similar Demographics by Female Poverty Among 18-24 Year Olds
Demographics Similar to Canadians by Female Poverty Among 18-24 Year Olds
In terms of female poverty among 18-24 year olds, the demographic groups most similar to Canadians are Immigrants from Bosnia and Herzegovina (19.7%, a difference of 0.020%), Immigrants from Northern Africa (19.7%, a difference of 0.030%), Slavic (19.7%, a difference of 0.060%), Immigrants from Austria (19.7%, a difference of 0.060%), and Panamanian (19.7%, a difference of 0.070%).
| Demographics | Rating | Rank | Female Poverty Among 18-24 Year Olds |
| Immigrants | Morocco | 89.9 /100 | #138 | Excellent 19.6% |
| Indians (Asian) | 88.3 /100 | #139 | Excellent 19.6% |
| Immigrants | Trinidad and Tobago | 85.6 /100 | #140 | Excellent 19.7% |
| Pennsylvania Germans | 85.5 /100 | #141 | Excellent 19.7% |
| Panamanians | 84.6 /100 | #142 | Excellent 19.7% |
| Slavs | 84.4 /100 | #143 | Excellent 19.7% |
| Immigrants | Northern Africa | 84.1 /100 | #144 | Excellent 19.7% |
| Canadians | 83.8 /100 | #145 | Excellent 19.7% |
| Immigrants | Bosnia and Herzegovina | 83.6 /100 | #146 | Excellent 19.7% |
| Immigrants | Austria | 83.1 /100 | #147 | Excellent 19.7% |
| Immigrants | Latin America | 81.3 /100 | #148 | Excellent 19.7% |
| Immigrants | Oceania | 81.2 /100 | #149 | Excellent 19.7% |
| Syrians | 80.2 /100 | #150 | Excellent 19.8% |
| Immigrants | Eastern Asia | 79.7 /100 | #151 | Good 19.8% |
| Yugoslavians | 79.0 /100 | #152 | Good 19.8% |
Demographics Similar to Immigrants from Grenada by Female Poverty Among 18-24 Year Olds
In terms of female poverty among 18-24 year olds, the demographic groups most similar to Immigrants from Grenada are British West Indian (21.2%, a difference of 0.030%), Tsimshian (21.2%, a difference of 0.15%), Taiwanese (21.2%, a difference of 0.26%), Delaware (21.1%, a difference of 0.32%), and South African (21.1%, a difference of 0.36%).
| Demographics | Rating | Rank | Female Poverty Among 18-24 Year Olds |
| Immigrants | Kenya | 2.5 /100 | #248 | Tragic 21.0% |
| Carpatho Rusyns | 2.5 /100 | #249 | Tragic 21.0% |
| Immigrants | West Indies | 2.2 /100 | #250 | Tragic 21.0% |
| West Indians | 1.9 /100 | #251 | Tragic 21.1% |
| South Africans | 1.6 /100 | #252 | Tragic 21.1% |
| Delaware | 1.6 /100 | #253 | Tragic 21.1% |
| British West Indians | 1.2 /100 | #254 | Tragic 21.2% |
| Immigrants | Grenada | 1.2 /100 | #255 | Tragic 21.2% |
| Tsimshian | 1.0 /100 | #256 | Tragic 21.2% |
| Taiwanese | 1.0 /100 | #257 | Tragic 21.2% |
| Vietnamese | 0.6 /100 | #258 | Tragic 21.4% |
| Immigrants | France | 0.6 /100 | #259 | Tragic 21.4% |
| Immigrants | Norway | 0.6 /100 | #260 | Tragic 21.4% |
| Immigrants | Bahamas | 0.5 /100 | #261 | Tragic 21.4% |
| Immigrants | Eastern Africa | 0.4 /100 | #262 | Tragic 21.4% |