Canadian vs Immigrants from Ethiopia Master's Degree
COMPARE
Canadian
Immigrants from Ethiopia
Master's Degree
Master's Degree Comparison
Canadians
Immigrants from Ethiopia
15.7%
MASTER'S DEGREE
83.3/ 100
METRIC RATING
144th/ 347
METRIC RANK
17.9%
MASTER'S DEGREE
99.8/ 100
METRIC RATING
68th/ 347
METRIC RANK
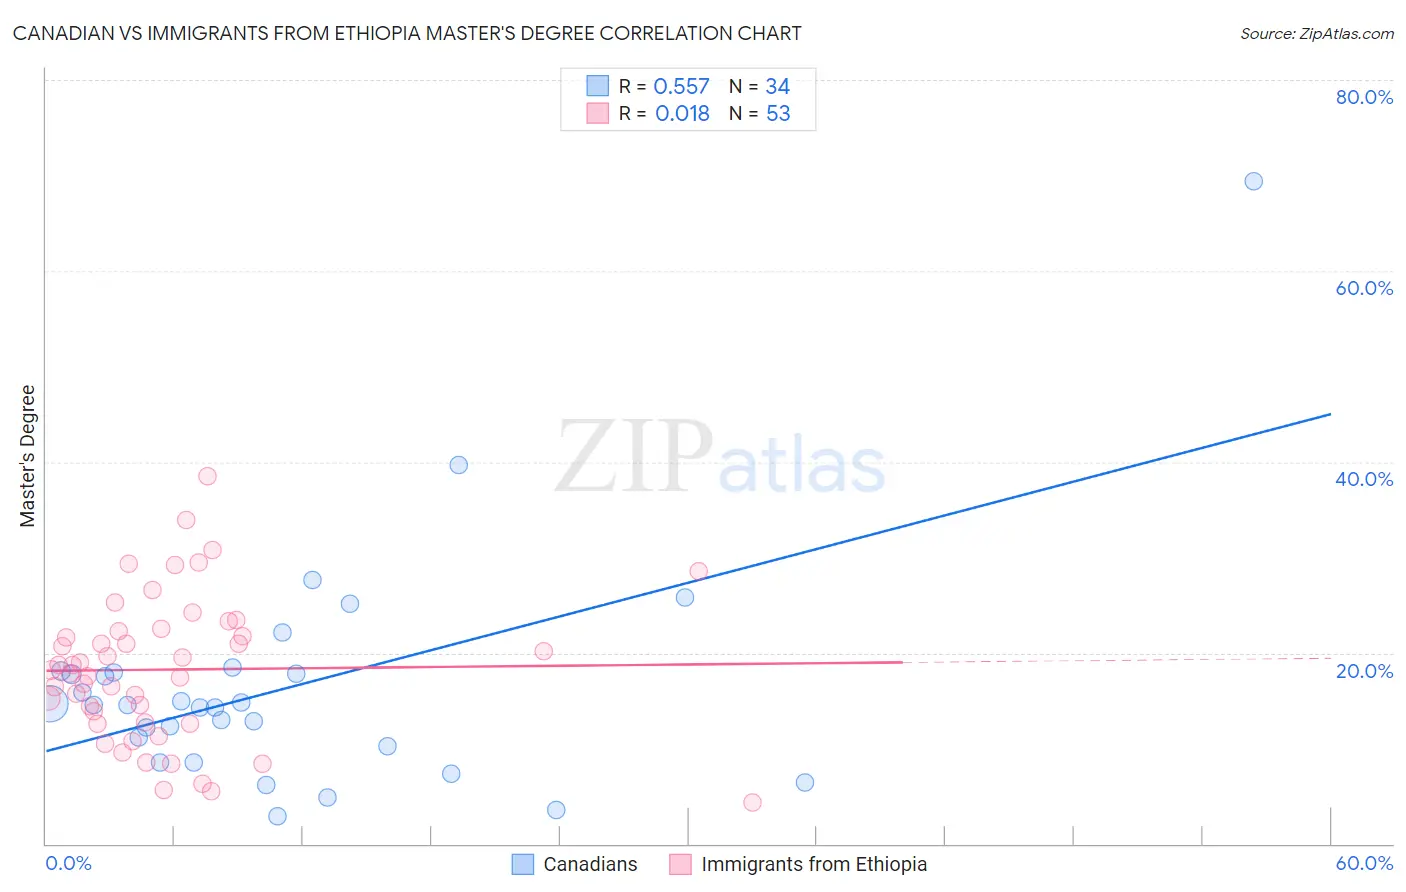
Canadian vs Immigrants from Ethiopia Master's Degree Correlation Chart
The statistical analysis conducted on geographies consisting of 437,396,402 people shows a substantial positive correlation between the proportion of Canadians and percentage of population with at least master's degree education in the United States with a correlation coefficient (R) of 0.557 and weighted average of 15.7%. Similarly, the statistical analysis conducted on geographies consisting of 211,528,614 people shows no correlation between the proportion of Immigrants from Ethiopia and percentage of population with at least master's degree education in the United States with a correlation coefficient (R) of 0.018 and weighted average of 17.9%, a difference of 14.2%.
Master's Degree Correlation Summary
| Measurement | Canadian | Immigrants from Ethiopia |
| Minimum | 2.8% | 4.3% |
| Maximum | 69.4% | 38.5% |
| Range | 66.6% | 34.2% |
| Mean | 16.3% | 18.2% |
| Median | 14.6% | 18.2% |
| Interquartile 25% (IQ1) | 10.2% | 12.6% |
| Interquartile 75% (IQ3) | 18.0% | 22.4% |
| Interquartile Range (IQR) | 7.8% | 9.8% |
| Standard Deviation (Sample) | 12.0% | 7.5% |
| Standard Deviation (Population) | 11.8% | 7.5% |
Similar Demographics by Master's Degree
Demographics Similar to Canadians by Master's Degree
In terms of master's degree, the demographic groups most similar to Canadians are Immigrants from Venezuela (15.7%, a difference of 0.080%), Immigrants from Africa (15.7%, a difference of 0.17%), Polish (15.7%, a difference of 0.40%), South American (15.6%, a difference of 0.42%), and Vietnamese (15.8%, a difference of 0.53%).
| Demographics | Rating | Rank | Master's Degree |
| Europeans | 86.4 /100 | #137 | Excellent 15.8% |
| Pakistanis | 86.1 /100 | #138 | Excellent 15.8% |
| Immigrants | Germany | 85.9 /100 | #139 | Excellent 15.8% |
| Vietnamese | 85.5 /100 | #140 | Excellent 15.8% |
| Poles | 85.0 /100 | #141 | Excellent 15.7% |
| Immigrants | Africa | 84.0 /100 | #142 | Excellent 15.7% |
| Immigrants | Venezuela | 83.6 /100 | #143 | Excellent 15.7% |
| Canadians | 83.3 /100 | #144 | Excellent 15.7% |
| South Americans | 81.3 /100 | #145 | Excellent 15.6% |
| Immigrants | Afghanistan | 79.4 /100 | #146 | Good 15.6% |
| Hungarians | 79.1 /100 | #147 | Good 15.6% |
| Immigrants | Senegal | 78.2 /100 | #148 | Good 15.5% |
| Ghanaians | 78.2 /100 | #149 | Good 15.5% |
| Slovenes | 78.0 /100 | #150 | Good 15.5% |
| Iraqis | 77.3 /100 | #151 | Good 15.5% |
Demographics Similar to Immigrants from Ethiopia by Master's Degree
In terms of master's degree, the demographic groups most similar to Immigrants from Ethiopia are Immigrants from Argentina (18.0%, a difference of 0.23%), Ethiopian (18.0%, a difference of 0.27%), Immigrants from Kazakhstan (18.0%, a difference of 0.30%), Immigrants from Uzbekistan (17.9%, a difference of 0.33%), and Immigrants from Western Europe (17.8%, a difference of 0.54%).
| Demographics | Rating | Rank | Master's Degree |
| Immigrants | Europe | 99.9 /100 | #61 | Exceptional 18.2% |
| Argentineans | 99.9 /100 | #62 | Exceptional 18.2% |
| Immigrants | Netherlands | 99.9 /100 | #63 | Exceptional 18.1% |
| South Africans | 99.9 /100 | #64 | Exceptional 18.1% |
| Immigrants | Kazakhstan | 99.8 /100 | #65 | Exceptional 18.0% |
| Ethiopians | 99.8 /100 | #66 | Exceptional 18.0% |
| Immigrants | Argentina | 99.8 /100 | #67 | Exceptional 18.0% |
| Immigrants | Ethiopia | 99.8 /100 | #68 | Exceptional 17.9% |
| Immigrants | Uzbekistan | 99.8 /100 | #69 | Exceptional 17.9% |
| Immigrants | Western Europe | 99.8 /100 | #70 | Exceptional 17.8% |
| Immigrants | Pakistan | 99.7 /100 | #71 | Exceptional 17.8% |
| Lithuanians | 99.7 /100 | #72 | Exceptional 17.7% |
| Zimbabweans | 99.7 /100 | #73 | Exceptional 17.7% |
| Immigrants | Romania | 99.7 /100 | #74 | Exceptional 17.7% |
| Egyptians | 99.6 /100 | #75 | Exceptional 17.6% |