Bhutanese vs Immigrants from Chile College, 1 year or more
COMPARE
Bhutanese
Immigrants from Chile
College, 1 year or more
College, 1 year or more Comparison
Bhutanese
Immigrants from Chile
64.6%
COLLEGE, 1 YEAR OR MORE
99.9/ 100
METRIC RATING
46th/ 347
METRIC RANK
61.4%
COLLEGE, 1 YEAR OR MORE
92.3/ 100
METRIC RATING
122nd/ 347
METRIC RANK
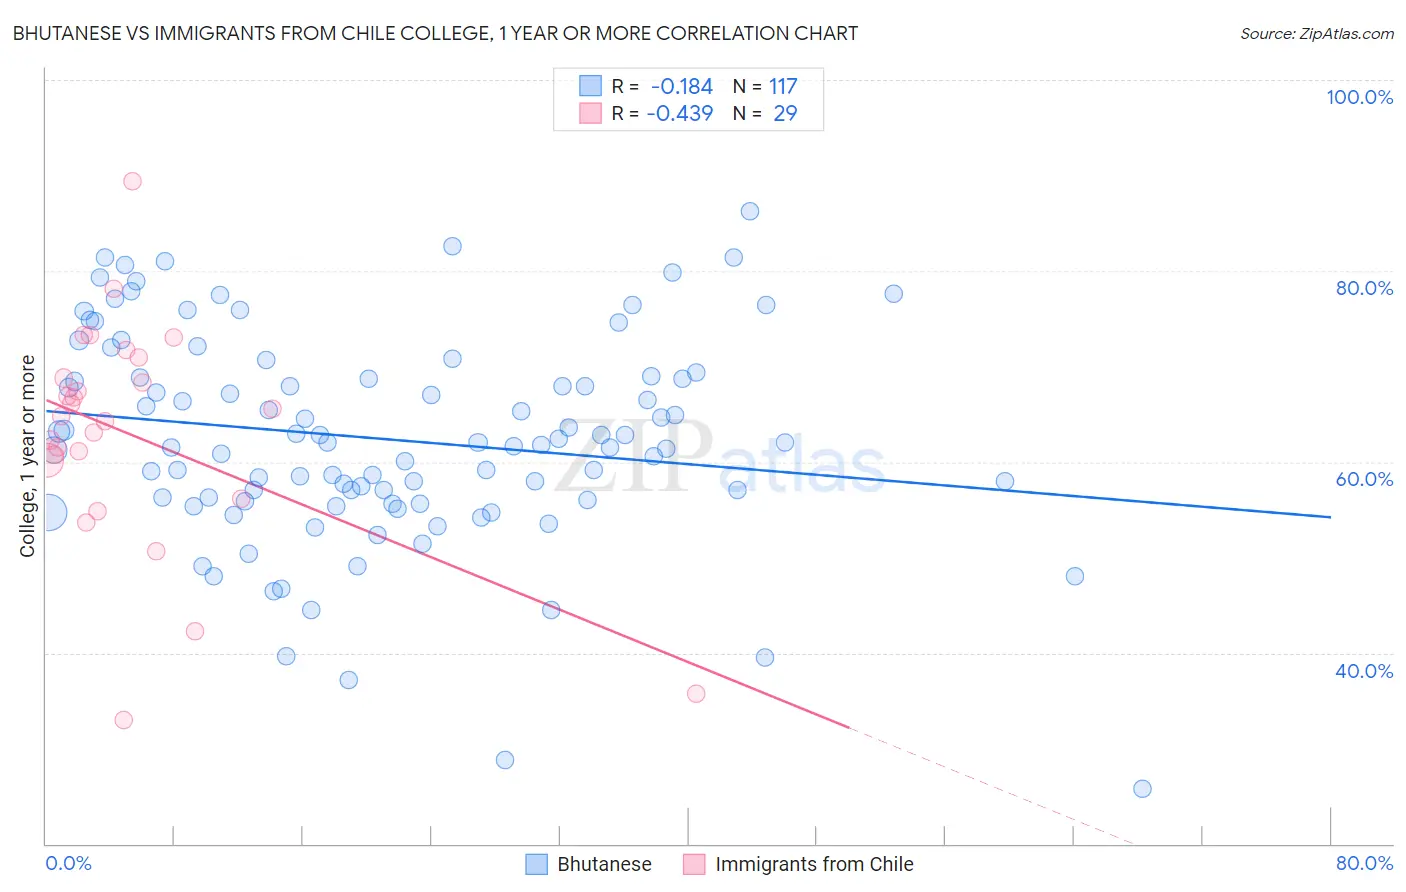
Bhutanese vs Immigrants from Chile College, 1 year or more Correlation Chart
The statistical analysis conducted on geographies consisting of 455,588,587 people shows a poor negative correlation between the proportion of Bhutanese and percentage of population with at least college, 1 year or more education in the United States with a correlation coefficient (R) of -0.184 and weighted average of 64.6%. Similarly, the statistical analysis conducted on geographies consisting of 218,647,266 people shows a moderate negative correlation between the proportion of Immigrants from Chile and percentage of population with at least college, 1 year or more education in the United States with a correlation coefficient (R) of -0.439 and weighted average of 61.4%, a difference of 5.3%.
College, 1 year or more Correlation Summary
| Measurement | Bhutanese | Immigrants from Chile |
| Minimum | 25.7% | 32.9% |
| Maximum | 86.2% | 89.4% |
| Range | 60.5% | 56.5% |
| Mean | 62.4% | 62.9% |
| Median | 62.0% | 64.7% |
| Interquartile 25% (IQ1) | 55.9% | 58.2% |
| Interquartile 75% (IQ3) | 69.0% | 69.8% |
| Interquartile Range (IQR) | 13.0% | 11.7% |
| Standard Deviation (Sample) | 11.1% | 11.9% |
| Standard Deviation (Population) | 11.1% | 11.7% |
Similar Demographics by College, 1 year or more
Demographics Similar to Bhutanese by College, 1 year or more
In terms of college, 1 year or more, the demographic groups most similar to Bhutanese are Immigrants from Lithuania (64.6%, a difference of 0.010%), Australian (64.6%, a difference of 0.010%), Immigrants from Bulgaria (64.6%, a difference of 0.040%), New Zealander (64.6%, a difference of 0.070%), and Immigrants from Norway (64.7%, a difference of 0.18%).
| Demographics | Rating | Rank | College, 1 year or more |
| Estonians | 99.9 /100 | #39 | Exceptional 65.0% |
| Immigrants | Kuwait | 99.9 /100 | #40 | Exceptional 65.0% |
| Mongolians | 99.9 /100 | #41 | Exceptional 64.8% |
| Immigrants | Latvia | 99.9 /100 | #42 | Exceptional 64.8% |
| Immigrants | Russia | 99.9 /100 | #43 | Exceptional 64.7% |
| Immigrants | Norway | 99.9 /100 | #44 | Exceptional 64.7% |
| Immigrants | Lithuania | 99.9 /100 | #45 | Exceptional 64.6% |
| Bhutanese | 99.9 /100 | #46 | Exceptional 64.6% |
| Australians | 99.9 /100 | #47 | Exceptional 64.6% |
| Immigrants | Bulgaria | 99.9 /100 | #48 | Exceptional 64.6% |
| New Zealanders | 99.9 /100 | #49 | Exceptional 64.6% |
| Immigrants | Austria | 99.8 /100 | #50 | Exceptional 64.4% |
| Immigrants | Malaysia | 99.8 /100 | #51 | Exceptional 64.3% |
| Immigrants | Netherlands | 99.8 /100 | #52 | Exceptional 64.2% |
| Asians | 99.8 /100 | #53 | Exceptional 64.2% |
Demographics Similar to Immigrants from Chile by College, 1 year or more
In terms of college, 1 year or more, the demographic groups most similar to Immigrants from Chile are Serbian (61.4%, a difference of 0.010%), Venezuelan (61.3%, a difference of 0.040%), Immigrants from Jordan (61.4%, a difference of 0.080%), Immigrants from Syria (61.3%, a difference of 0.12%), and Alsatian (61.3%, a difference of 0.16%).
| Demographics | Rating | Rank | College, 1 year or more |
| Norwegians | 94.5 /100 | #115 | Exceptional 61.7% |
| Lebanese | 94.1 /100 | #116 | Exceptional 61.6% |
| Arabs | 93.9 /100 | #117 | Exceptional 61.6% |
| Immigrants | Brazil | 93.9 /100 | #118 | Exceptional 61.6% |
| Assyrians/Chaldeans/Syriacs | 93.3 /100 | #119 | Exceptional 61.5% |
| Pakistanis | 93.2 /100 | #120 | Exceptional 61.5% |
| Immigrants | Jordan | 92.7 /100 | #121 | Exceptional 61.4% |
| Immigrants | Chile | 92.3 /100 | #122 | Exceptional 61.4% |
| Serbians | 92.2 /100 | #123 | Exceptional 61.4% |
| Venezuelans | 92.1 /100 | #124 | Exceptional 61.3% |
| Immigrants | Syria | 91.6 /100 | #125 | Exceptional 61.3% |
| Alsatians | 91.3 /100 | #126 | Exceptional 61.3% |
| Immigrants | Eastern Africa | 91.1 /100 | #127 | Exceptional 61.2% |
| Immigrants | Italy | 91.1 /100 | #128 | Exceptional 61.2% |
| Ugandans | 90.7 /100 | #129 | Exceptional 61.2% |