Canadian vs Immigrants from Chile 4th Grade
COMPARE
Canadian
Immigrants from Chile
4th Grade
4th Grade Comparison
Canadians
Immigrants from Chile
98.0%
4TH GRADE
99.6/ 100
METRIC RATING
66th/ 347
METRIC RANK
97.4%
4TH GRADE
16.1/ 100
METRIC RATING
202nd/ 347
METRIC RANK
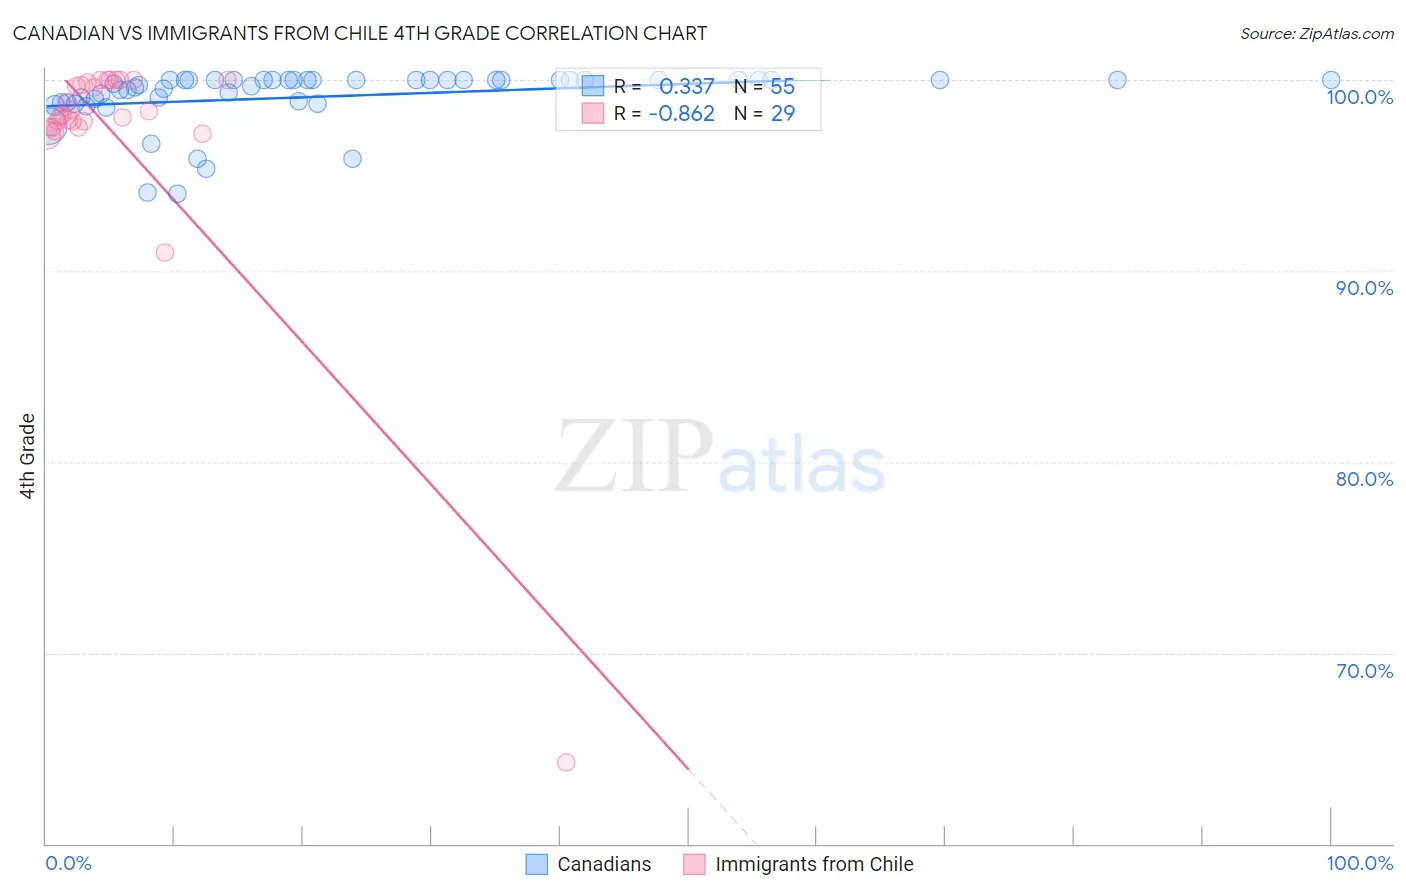
Canadian vs Immigrants from Chile 4th Grade Correlation Chart
The statistical analysis conducted on geographies consisting of 437,557,033 people shows a mild positive correlation between the proportion of Canadians and percentage of population with at least 4th grade education in the United States with a correlation coefficient (R) of 0.337 and weighted average of 98.0%. Similarly, the statistical analysis conducted on geographies consisting of 218,647,266 people shows a very strong negative correlation between the proportion of Immigrants from Chile and percentage of population with at least 4th grade education in the United States with a correlation coefficient (R) of -0.862 and weighted average of 97.4%, a difference of 0.68%.
4th Grade Correlation Summary
| Measurement | Canadian | Immigrants from Chile |
| Minimum | 94.0% | 64.3% |
| Maximum | 100.0% | 100.0% |
| Range | 6.0% | 35.7% |
| Mean | 99.1% | 97.2% |
| Median | 100.0% | 98.1% |
| Interquartile 25% (IQ1) | 98.8% | 97.5% |
| Interquartile 75% (IQ3) | 100.0% | 99.9% |
| Interquartile Range (IQR) | 1.2% | 2.4% |
| Standard Deviation (Sample) | 1.5% | 6.6% |
| Standard Deviation (Population) | 1.5% | 6.5% |
Similar Demographics by 4th Grade
Demographics Similar to Canadians by 4th Grade
In terms of 4th grade, the demographic groups most similar to Canadians are Immigrants from Northern Europe (98.0%, a difference of 0.0%), New Zealander (98.0%, a difference of 0.0%), Russian (98.0%, a difference of 0.010%), Cajun (98.0%, a difference of 0.010%), and Kiowa (98.0%, a difference of 0.010%).
| Demographics | Rating | Rank | 4th Grade |
| Americans | 99.8 /100 | #59 | Exceptional 98.1% |
| Immigrants | Canada | 99.7 /100 | #60 | Exceptional 98.1% |
| Immigrants | North America | 99.7 /100 | #61 | Exceptional 98.1% |
| Serbians | 99.7 /100 | #62 | Exceptional 98.1% |
| Russians | 99.7 /100 | #63 | Exceptional 98.0% |
| Cajuns | 99.7 /100 | #64 | Exceptional 98.0% |
| Immigrants | Northern Europe | 99.6 /100 | #65 | Exceptional 98.0% |
| Canadians | 99.6 /100 | #66 | Exceptional 98.0% |
| New Zealanders | 99.6 /100 | #67 | Exceptional 98.0% |
| Kiowa | 99.6 /100 | #68 | Exceptional 98.0% |
| Pueblo | 99.6 /100 | #69 | Exceptional 98.0% |
| Immigrants | Austria | 99.6 /100 | #70 | Exceptional 98.0% |
| Lumbee | 99.6 /100 | #71 | Exceptional 98.0% |
| Iranians | 99.4 /100 | #72 | Exceptional 98.0% |
| Macedonians | 99.4 /100 | #73 | Exceptional 98.0% |
Demographics Similar to Immigrants from Chile by 4th Grade
In terms of 4th grade, the demographic groups most similar to Immigrants from Chile are Immigrants from Southern Europe (97.4%, a difference of 0.0%), Immigrants from Northern Africa (97.4%, a difference of 0.010%), African (97.4%, a difference of 0.010%), Immigrants from Uganda (97.4%, a difference of 0.020%), and Paiute (97.3%, a difference of 0.020%).
| Demographics | Rating | Rank | 4th Grade |
| Paraguayans | 28.9 /100 | #195 | Fair 97.4% |
| Immigrants | Albania | 27.7 /100 | #196 | Fair 97.4% |
| Hawaiians | 25.6 /100 | #197 | Fair 97.4% |
| Guamanians/Chamorros | 23.0 /100 | #198 | Fair 97.4% |
| Natives/Alaskans | 20.6 /100 | #199 | Fair 97.4% |
| Immigrants | Uganda | 19.8 /100 | #200 | Poor 97.4% |
| Immigrants | Southern Europe | 16.2 /100 | #201 | Poor 97.4% |
| Immigrants | Chile | 16.1 /100 | #202 | Poor 97.4% |
| Immigrants | Northern Africa | 15.1 /100 | #203 | Poor 97.4% |
| Africans | 14.6 /100 | #204 | Poor 97.4% |
| Paiute | 13.2 /100 | #205 | Poor 97.3% |
| Immigrants | Zaire | 12.8 /100 | #206 | Poor 97.3% |
| Moroccans | 11.3 /100 | #207 | Poor 97.3% |
| Immigrants | Bahamas | 10.8 /100 | #208 | Poor 97.3% |
| Laotians | 9.3 /100 | #209 | Tragic 97.3% |