Cajun vs U.S. Virgin Islander Median Male Earnings
COMPARE
Cajun
U.S. Virgin Islander
Median Male Earnings
Median Male Earnings Comparison
Cajuns
U.S. Virgin Islanders
$52,325
MEDIAN MALE EARNINGS
10.7/ 100
METRIC RATING
212th/ 347
METRIC RANK
$47,066
MEDIAN MALE EARNINGS
0.1/ 100
METRIC RATING
300th/ 347
METRIC RANK
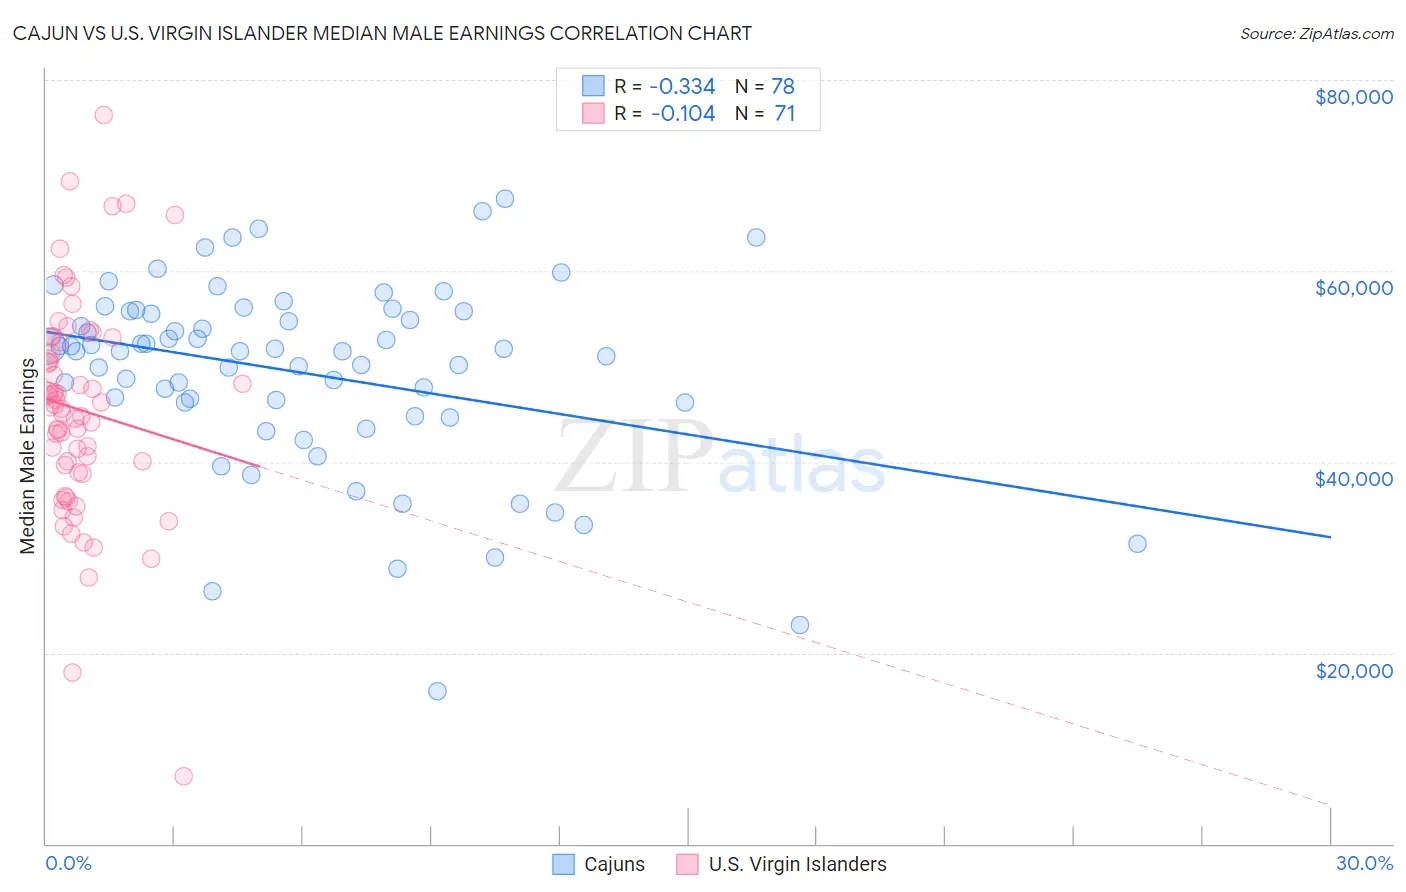
Cajun vs U.S. Virgin Islander Median Male Earnings Correlation Chart
The statistical analysis conducted on geographies consisting of 149,660,715 people shows a mild negative correlation between the proportion of Cajuns and median male earnings in the United States with a correlation coefficient (R) of -0.334 and weighted average of $52,325. Similarly, the statistical analysis conducted on geographies consisting of 87,522,677 people shows a poor negative correlation between the proportion of U.S. Virgin Islanders and median male earnings in the United States with a correlation coefficient (R) of -0.104 and weighted average of $47,066, a difference of 11.2%.
Median Male Earnings Correlation Summary
| Measurement | Cajun | U.S. Virgin Islander |
| Minimum | $15,945 | $7,097 |
| Maximum | $67,496 | $76,348 |
| Range | $51,551 | $69,251 |
| Mean | $49,309 | $45,487 |
| Median | $51,622 | $45,658 |
| Interquartile 25% (IQ1) | $46,199 | $38,902 |
| Interquartile 75% (IQ3) | $55,757 | $52,442 |
| Interquartile Range (IQR) | $9,558 | $13,540 |
| Standard Deviation (Sample) | $9,949 | $11,420 |
| Standard Deviation (Population) | $9,885 | $11,340 |
Similar Demographics by Median Male Earnings
Demographics Similar to Cajuns by Median Male Earnings
In terms of median male earnings, the demographic groups most similar to Cajuns are Native Hawaiian ($52,306, a difference of 0.040%), Tlingit-Haida ($52,409, a difference of 0.16%), Delaware ($52,412, a difference of 0.17%), Bermudan ($52,465, a difference of 0.27%), and Nonimmigrants ($52,170, a difference of 0.30%).
| Demographics | Rating | Rank | Median Male Earnings |
| Immigrants | Colombia | 15.0 /100 | #205 | Poor $52,725 |
| Immigrants | Iraq | 14.5 /100 | #206 | Poor $52,681 |
| Vietnamese | 12.7 /100 | #207 | Poor $52,525 |
| Venezuelans | 12.5 /100 | #208 | Poor $52,510 |
| Bermudans | 12.1 /100 | #209 | Poor $52,465 |
| Delaware | 11.5 /100 | #210 | Poor $52,412 |
| Tlingit-Haida | 11.5 /100 | #211 | Poor $52,409 |
| Cajuns | 10.7 /100 | #212 | Poor $52,325 |
| Native Hawaiians | 10.5 /100 | #213 | Poor $52,306 |
| Immigrants | Nonimmigrants | 9.3 /100 | #214 | Tragic $52,170 |
| Immigrants | Cameroon | 8.9 /100 | #215 | Tragic $52,119 |
| Immigrants | Venezuela | 8.3 /100 | #216 | Tragic $52,041 |
| Nigerians | 8.3 /100 | #217 | Tragic $52,039 |
| Immigrants | Panama | 7.7 /100 | #218 | Tragic $51,962 |
| Immigrants | Ghana | 6.9 /100 | #219 | Tragic $51,836 |
Demographics Similar to U.S. Virgin Islanders by Median Male Earnings
In terms of median male earnings, the demographic groups most similar to U.S. Virgin Islanders are Immigrants from Zaire ($47,070, a difference of 0.010%), Immigrants from Micronesia ($47,177, a difference of 0.23%), Immigrants from Latin America ($46,941, a difference of 0.27%), Dominican ($47,204, a difference of 0.29%), and Inupiat ($47,281, a difference of 0.46%).
| Demographics | Rating | Rank | Median Male Earnings |
| Indonesians | 0.1 /100 | #293 | Tragic $47,503 |
| Immigrants | Nicaragua | 0.1 /100 | #294 | Tragic $47,482 |
| Central American Indians | 0.1 /100 | #295 | Tragic $47,433 |
| Inupiat | 0.1 /100 | #296 | Tragic $47,281 |
| Dominicans | 0.1 /100 | #297 | Tragic $47,204 |
| Immigrants | Micronesia | 0.1 /100 | #298 | Tragic $47,177 |
| Immigrants | Zaire | 0.1 /100 | #299 | Tragic $47,070 |
| U.S. Virgin Islanders | 0.1 /100 | #300 | Tragic $47,066 |
| Immigrants | Latin America | 0.1 /100 | #301 | Tragic $46,941 |
| Seminole | 0.1 /100 | #302 | Tragic $46,783 |
| Yaqui | 0.1 /100 | #303 | Tragic $46,777 |
| Bangladeshis | 0.1 /100 | #304 | Tragic $46,744 |
| Guatemalans | 0.0 /100 | #305 | Tragic $46,736 |
| Dutch West Indians | 0.0 /100 | #306 | Tragic $46,656 |
| Immigrants | Dominican Republic | 0.0 /100 | #307 | Tragic $46,655 |