Cajun vs U.S. Virgin Islander Ambulatory Disability
COMPARE
Cajun
U.S. Virgin Islander
Ambulatory Disability
Ambulatory Disability Comparison
Cajuns
U.S. Virgin Islanders
7.8%
AMBULATORY DISABILITY
0.0/ 100
METRIC RATING
331st/ 347
METRIC RANK
6.8%
AMBULATORY DISABILITY
0.0/ 100
METRIC RATING
287th/ 347
METRIC RANK
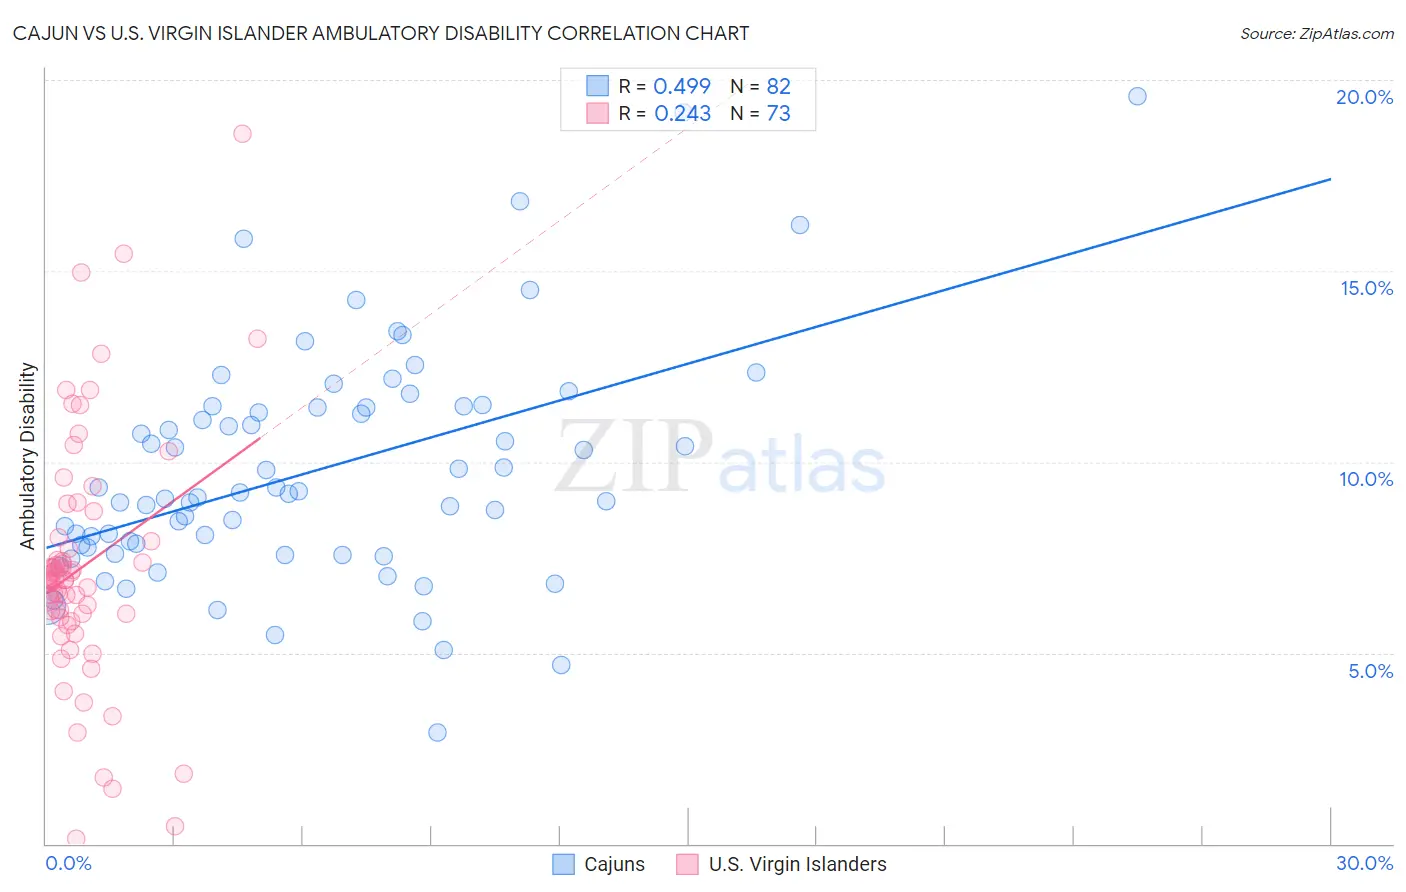
Cajun vs U.S. Virgin Islander Ambulatory Disability Correlation Chart
The statistical analysis conducted on geographies consisting of 149,692,949 people shows a moderate positive correlation between the proportion of Cajuns and percentage of population with ambulatory disability in the United States with a correlation coefficient (R) of 0.499 and weighted average of 7.8%. Similarly, the statistical analysis conducted on geographies consisting of 87,521,304 people shows a weak positive correlation between the proportion of U.S. Virgin Islanders and percentage of population with ambulatory disability in the United States with a correlation coefficient (R) of 0.243 and weighted average of 6.8%, a difference of 13.9%.
Ambulatory Disability Correlation Summary
| Measurement | Cajun | U.S. Virgin Islander |
| Minimum | 2.9% | 0.13% |
| Maximum | 19.6% | 18.6% |
| Range | 16.7% | 18.5% |
| Mean | 9.8% | 7.2% |
| Median | 9.2% | 6.9% |
| Interquartile 25% (IQ1) | 7.7% | 6.0% |
| Interquartile 75% (IQ3) | 11.4% | 8.0% |
| Interquartile Range (IQR) | 3.7% | 2.0% |
| Standard Deviation (Sample) | 3.0% | 3.2% |
| Standard Deviation (Population) | 3.0% | 3.2% |
Similar Demographics by Ambulatory Disability
Demographics Similar to Cajuns by Ambulatory Disability
In terms of ambulatory disability, the demographic groups most similar to Cajuns are Menominee (7.8%, a difference of 0.28%), Cherokee (7.9%, a difference of 1.2%), Paiute (7.7%, a difference of 1.2%), Yuman (7.9%, a difference of 2.1%), and Pueblo (7.6%, a difference of 2.5%).
| Demographics | Rating | Rank | Ambulatory Disability |
| Navajo | 0.0 /100 | #324 | Tragic 7.5% |
| Comanche | 0.0 /100 | #325 | Tragic 7.5% |
| Blacks/African Americans | 0.0 /100 | #326 | Tragic 7.5% |
| Natives/Alaskans | 0.0 /100 | #327 | Tragic 7.5% |
| Hopi | 0.0 /100 | #328 | Tragic 7.6% |
| Pueblo | 0.0 /100 | #329 | Tragic 7.6% |
| Paiute | 0.0 /100 | #330 | Tragic 7.7% |
| Cajuns | 0.0 /100 | #331 | Tragic 7.8% |
| Menominee | 0.0 /100 | #332 | Tragic 7.8% |
| Cherokee | 0.0 /100 | #333 | Tragic 7.9% |
| Yuman | 0.0 /100 | #334 | Tragic 7.9% |
| Chickasaw | 0.0 /100 | #335 | Tragic 8.0% |
| Seminole | 0.0 /100 | #336 | Tragic 8.0% |
| Dutch West Indians | 0.0 /100 | #337 | Tragic 8.2% |
| Colville | 0.0 /100 | #338 | Tragic 8.2% |
Demographics Similar to U.S. Virgin Islanders by Ambulatory Disability
In terms of ambulatory disability, the demographic groups most similar to U.S. Virgin Islanders are Nonimmigrants (6.9%, a difference of 0.27%), Yakama (6.8%, a difference of 0.32%), Fijian (6.8%, a difference of 0.36%), Immigrants from Dominica (6.9%, a difference of 0.41%), and Scotch-Irish (6.9%, a difference of 0.44%).
| Demographics | Rating | Rank | Ambulatory Disability |
| Pennsylvania Germans | 0.0 /100 | #280 | Tragic 6.8% |
| Yaqui | 0.0 /100 | #281 | Tragic 6.8% |
| Barbadians | 0.0 /100 | #282 | Tragic 6.8% |
| Immigrants | Barbados | 0.0 /100 | #283 | Tragic 6.8% |
| Immigrants | Jamaica | 0.0 /100 | #284 | Tragic 6.8% |
| Fijians | 0.0 /100 | #285 | Tragic 6.8% |
| Yakama | 0.0 /100 | #286 | Tragic 6.8% |
| U.S. Virgin Islanders | 0.0 /100 | #287 | Tragic 6.8% |
| Immigrants | Nonimmigrants | 0.0 /100 | #288 | Tragic 6.9% |
| Immigrants | Dominica | 0.0 /100 | #289 | Tragic 6.9% |
| Scotch-Irish | 0.0 /100 | #290 | Tragic 6.9% |
| West Indians | 0.0 /100 | #291 | Tragic 6.9% |
| Cheyenne | 0.0 /100 | #292 | Tragic 6.9% |
| Immigrants | St. Vincent and the Grenadines | 0.0 /100 | #293 | Tragic 6.9% |
| Cape Verdeans | 0.0 /100 | #294 | Tragic 6.9% |