Cajun vs Arab Kindergarten
COMPARE
Cajun
Arab
Kindergarten
Kindergarten Comparison
Cajuns
Arabs
98.3%
KINDERGARTEN
99.4/ 100
METRIC RATING
73rd/ 347
METRIC RANK
97.9%
KINDERGARTEN
35.4/ 100
METRIC RATING
188th/ 347
METRIC RANK
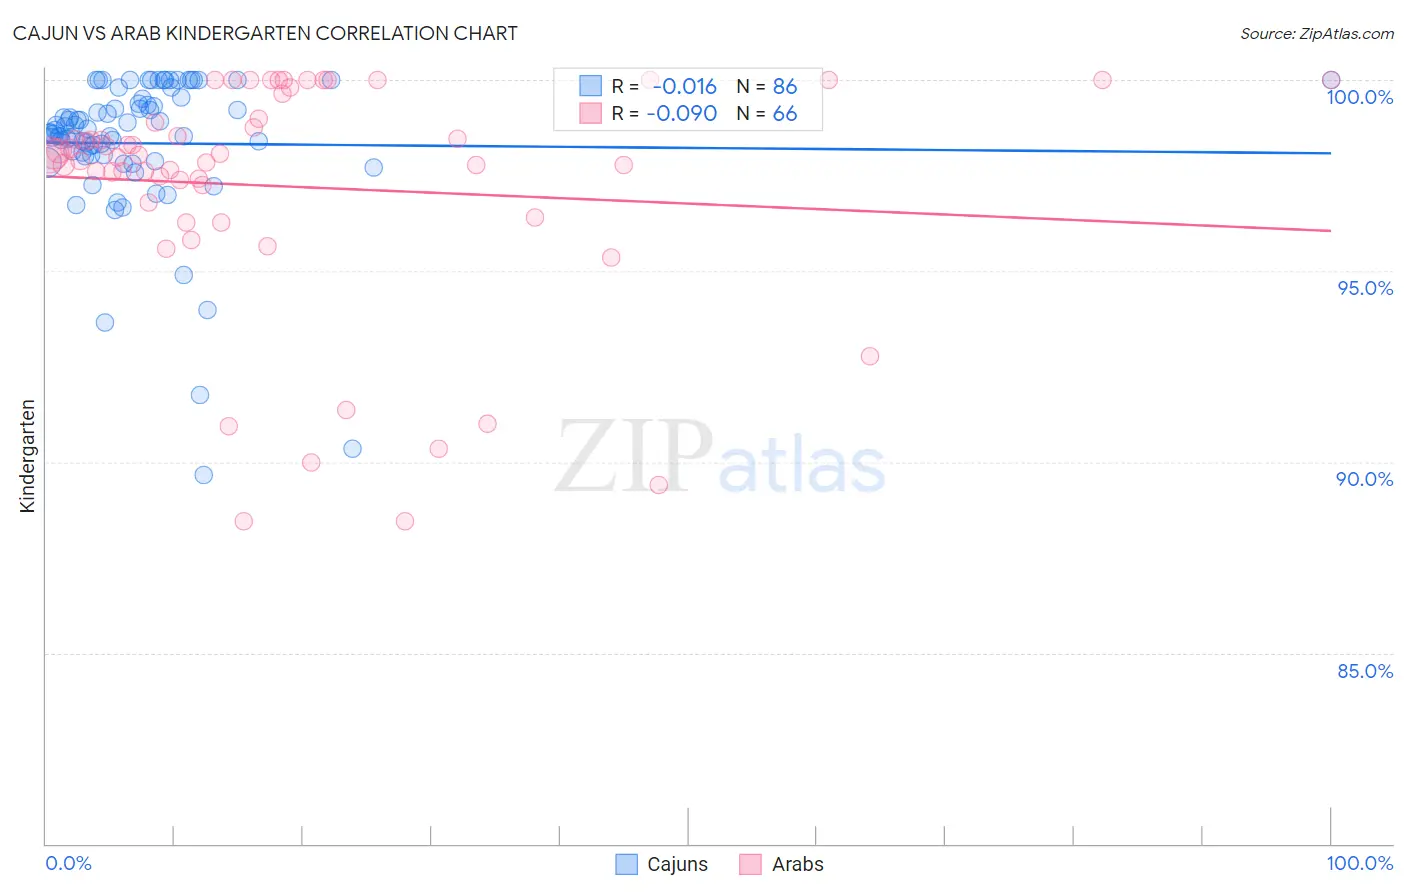
Cajun vs Arab Kindergarten Correlation Chart
The statistical analysis conducted on geographies consisting of 149,712,957 people shows no correlation between the proportion of Cajuns and percentage of population with at least kindergarten education in the United States with a correlation coefficient (R) of -0.016 and weighted average of 98.3%. Similarly, the statistical analysis conducted on geographies consisting of 486,872,222 people shows a slight negative correlation between the proportion of Arabs and percentage of population with at least kindergarten education in the United States with a correlation coefficient (R) of -0.090 and weighted average of 97.9%, a difference of 0.44%.
Kindergarten Correlation Summary
| Measurement | Cajun | Arab |
| Minimum | 89.7% | 88.4% |
| Maximum | 100.0% | 100.0% |
| Range | 10.3% | 11.6% |
| Mean | 98.3% | 97.2% |
| Median | 98.7% | 98.0% |
| Interquartile 25% (IQ1) | 98.0% | 96.8% |
| Interquartile 75% (IQ3) | 99.5% | 99.0% |
| Interquartile Range (IQR) | 1.5% | 2.2% |
| Standard Deviation (Sample) | 1.9% | 3.1% |
| Standard Deviation (Population) | 1.9% | 3.0% |
Similar Demographics by Kindergarten
Demographics Similar to Cajuns by Kindergarten
In terms of kindergarten, the demographic groups most similar to Cajuns are Immigrants from Netherlands (98.3%, a difference of 0.010%), Cherokee (98.3%, a difference of 0.010%), Immigrants from England (98.3%, a difference of 0.010%), Delaware (98.3%, a difference of 0.020%), and Shoshone (98.3%, a difference of 0.020%).
| Demographics | Rating | Rank | Kindergarten |
| Cheyenne | 99.6 /100 | #66 | Exceptional 98.4% |
| Canadians | 99.6 /100 | #67 | Exceptional 98.4% |
| Immigrants | Northern Europe | 99.6 /100 | #68 | Exceptional 98.4% |
| Immigrants | Austria | 99.6 /100 | #69 | Exceptional 98.4% |
| Russians | 99.6 /100 | #70 | Exceptional 98.4% |
| Chickasaw | 99.6 /100 | #71 | Exceptional 98.4% |
| Serbians | 99.6 /100 | #72 | Exceptional 98.4% |
| Cajuns | 99.4 /100 | #73 | Exceptional 98.3% |
| Immigrants | Netherlands | 99.3 /100 | #74 | Exceptional 98.3% |
| Cherokee | 99.3 /100 | #75 | Exceptional 98.3% |
| Immigrants | England | 99.3 /100 | #76 | Exceptional 98.3% |
| Delaware | 99.3 /100 | #77 | Exceptional 98.3% |
| Shoshone | 99.2 /100 | #78 | Exceptional 98.3% |
| Immigrants | Belgium | 99.2 /100 | #79 | Exceptional 98.3% |
| Immigrants | Lithuania | 99.2 /100 | #80 | Exceptional 98.3% |
Demographics Similar to Arabs by Kindergarten
In terms of kindergarten, the demographic groups most similar to Arabs are Pakistani (97.9%, a difference of 0.0%), Immigrants from Kazakhstan (97.9%, a difference of 0.0%), Paiute (97.9%, a difference of 0.0%), Immigrants from Belarus (97.9%, a difference of 0.010%), and Panamanian (97.9%, a difference of 0.010%).
| Demographics | Rating | Rank | Kindergarten |
| Portuguese | 43.5 /100 | #181 | Average 97.9% |
| Egyptians | 42.4 /100 | #182 | Average 97.9% |
| Immigrants | Poland | 41.4 /100 | #183 | Average 97.9% |
| Immigrants | Argentina | 40.7 /100 | #184 | Average 97.9% |
| Immigrants | Belarus | 39.4 /100 | #185 | Fair 97.9% |
| Pakistanis | 36.0 /100 | #186 | Fair 97.9% |
| Immigrants | Kazakhstan | 35.9 /100 | #187 | Fair 97.9% |
| Arabs | 35.4 /100 | #188 | Fair 97.9% |
| Paiute | 34.7 /100 | #189 | Fair 97.9% |
| Panamanians | 33.3 /100 | #190 | Fair 97.9% |
| Immigrants | Taiwan | 30.7 /100 | #191 | Fair 97.9% |
| Blacks/African Americans | 29.9 /100 | #192 | Fair 97.9% |
| Paraguayans | 29.6 /100 | #193 | Fair 97.9% |
| Hawaiians | 29.3 /100 | #194 | Fair 97.9% |
| Mongolians | 28.9 /100 | #195 | Fair 97.9% |