Laotian vs Arab College, Under 1 year
COMPARE
Laotian
Arab
College, Under 1 year
College, Under 1 year Comparison
Laotians
Arabs
68.5%
COLLEGE, UNDER 1 YEAR
98.6/ 100
METRIC RATING
76th/ 347
METRIC RANK
67.2%
COLLEGE, UNDER 1 YEAR
92.6/ 100
METRIC RATING
124th/ 347
METRIC RANK
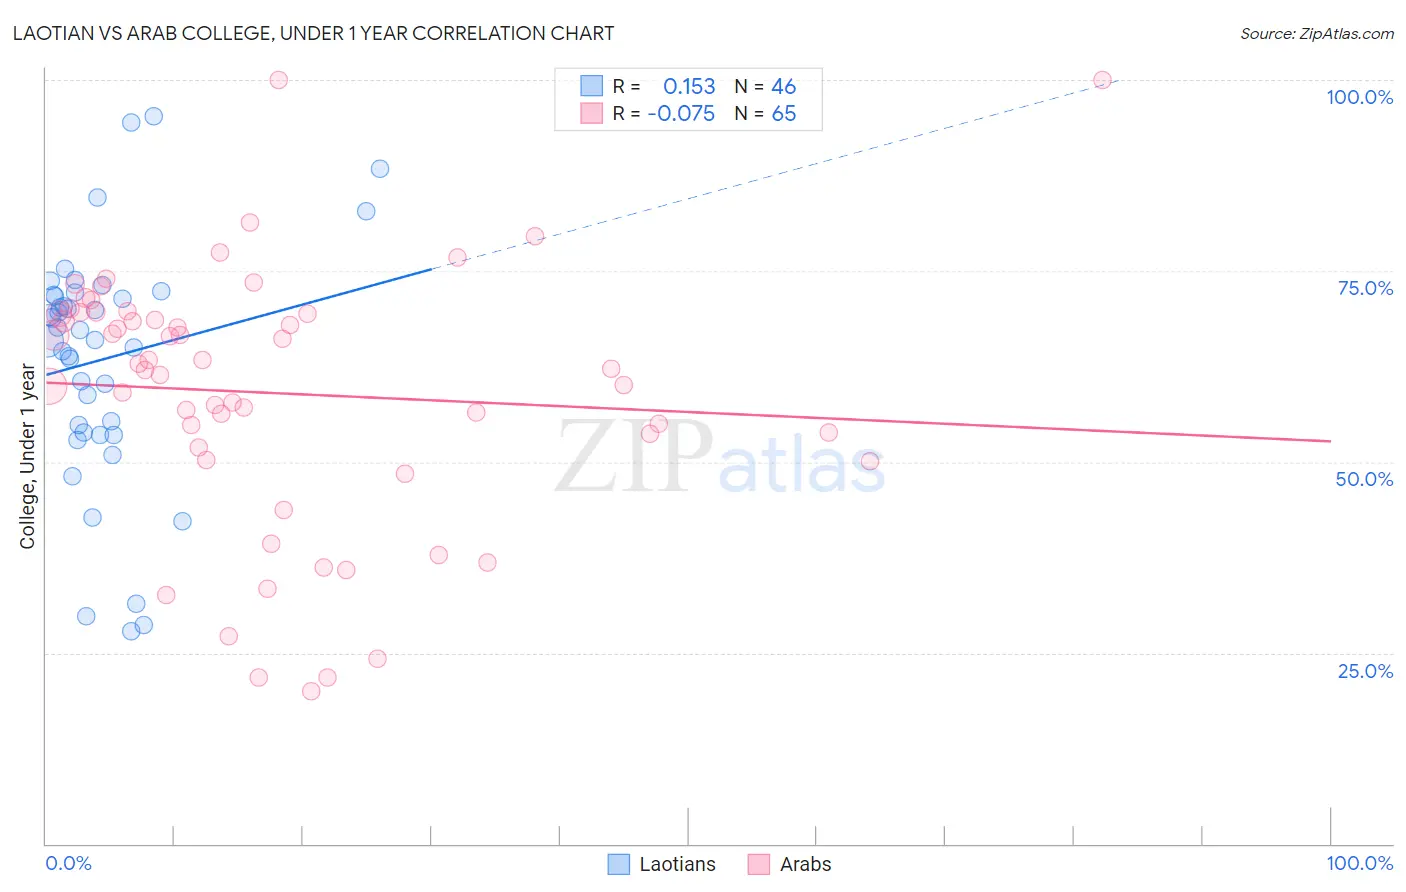
Laotian vs Arab College, Under 1 year Correlation Chart
The statistical analysis conducted on geographies consisting of 224,861,279 people shows a poor positive correlation between the proportion of Laotians and percentage of population with at least college, under 1 year education in the United States with a correlation coefficient (R) of 0.153 and weighted average of 68.5%. Similarly, the statistical analysis conducted on geographies consisting of 486,870,114 people shows a slight negative correlation between the proportion of Arabs and percentage of population with at least college, under 1 year education in the United States with a correlation coefficient (R) of -0.075 and weighted average of 67.2%, a difference of 1.9%.
College, Under 1 year Correlation Summary
| Measurement | Laotian | Arab |
| Minimum | 27.8% | 20.0% |
| Maximum | 95.2% | 100.0% |
| Range | 67.5% | 80.0% |
| Mean | 63.4% | 59.0% |
| Median | 66.6% | 62.3% |
| Interquartile 25% (IQ1) | 53.9% | 51.1% |
| Interquartile 75% (IQ3) | 71.9% | 69.5% |
| Interquartile Range (IQR) | 18.0% | 18.5% |
| Standard Deviation (Sample) | 15.7% | 17.0% |
| Standard Deviation (Population) | 15.5% | 16.9% |
Similar Demographics by College, Under 1 year
Demographics Similar to Laotians by College, Under 1 year
In terms of college, under 1 year, the demographic groups most similar to Laotians are Immigrants from Western Europe (68.5%, a difference of 0.0%), British (68.5%, a difference of 0.040%), Danish (68.5%, a difference of 0.050%), Greek (68.5%, a difference of 0.070%), and Immigrants from Spain (68.4%, a difference of 0.090%).
| Demographics | Rating | Rank | College, Under 1 year |
| Immigrants | Romania | 99.2 /100 | #69 | Exceptional 68.9% |
| Lithuanians | 99.1 /100 | #70 | Exceptional 68.8% |
| Immigrants | Europe | 99.1 /100 | #71 | Exceptional 68.8% |
| Bolivians | 99.0 /100 | #72 | Exceptional 68.7% |
| Immigrants | England | 99.0 /100 | #73 | Exceptional 68.7% |
| Swedes | 98.9 /100 | #74 | Exceptional 68.7% |
| Immigrants | Western Europe | 98.6 /100 | #75 | Exceptional 68.5% |
| Laotians | 98.6 /100 | #76 | Exceptional 68.5% |
| British | 98.6 /100 | #77 | Exceptional 68.5% |
| Danes | 98.6 /100 | #78 | Exceptional 68.5% |
| Greeks | 98.6 /100 | #79 | Exceptional 68.5% |
| Immigrants | Spain | 98.5 /100 | #80 | Exceptional 68.4% |
| Immigrants | Greece | 98.5 /100 | #81 | Exceptional 68.4% |
| Norwegians | 98.4 /100 | #82 | Exceptional 68.4% |
| Argentineans | 98.4 /100 | #83 | Exceptional 68.4% |
Demographics Similar to Arabs by College, Under 1 year
In terms of college, under 1 year, the demographic groups most similar to Arabs are Immigrants from Northern Africa (67.2%, a difference of 0.010%), Immigrants from Jordan (67.3%, a difference of 0.030%), Slovene (67.3%, a difference of 0.12%), Italian (67.2%, a difference of 0.12%), and Alsatian (67.1%, a difference of 0.18%).
| Demographics | Rating | Rank | College, Under 1 year |
| Pakistanis | 94.8 /100 | #117 | Exceptional 67.5% |
| Immigrants | Ukraine | 94.7 /100 | #118 | Exceptional 67.5% |
| Lebanese | 94.6 /100 | #119 | Exceptional 67.5% |
| Serbians | 93.9 /100 | #120 | Exceptional 67.4% |
| Slovenes | 93.3 /100 | #121 | Exceptional 67.3% |
| Immigrants | Jordan | 92.8 /100 | #122 | Exceptional 67.3% |
| Immigrants | Northern Africa | 92.7 /100 | #123 | Exceptional 67.2% |
| Arabs | 92.6 /100 | #124 | Exceptional 67.2% |
| Italians | 91.8 /100 | #125 | Exceptional 67.2% |
| Alsatians | 91.3 /100 | #126 | Exceptional 67.1% |
| Czechs | 90.8 /100 | #127 | Exceptional 67.1% |
| Scottish | 90.2 /100 | #128 | Exceptional 67.0% |
| Immigrants | Eastern Africa | 89.5 /100 | #129 | Excellent 67.0% |
| Immigrants | Syria | 89.0 /100 | #130 | Excellent 66.9% |
| Finns | 88.6 /100 | #131 | Excellent 66.9% |