Cajun vs Arab 12th Grade, No Diploma
COMPARE
Cajun
Arab
12th Grade, No Diploma
12th Grade, No Diploma Comparison
Cajuns
Arabs
89.1%
12TH GRADE, NO DIPLOMA
0.1/ 100
METRIC RATING
274th/ 347
METRIC RANK
91.6%
12TH GRADE, NO DIPLOMA
84.1/ 100
METRIC RATING
138th/ 347
METRIC RANK
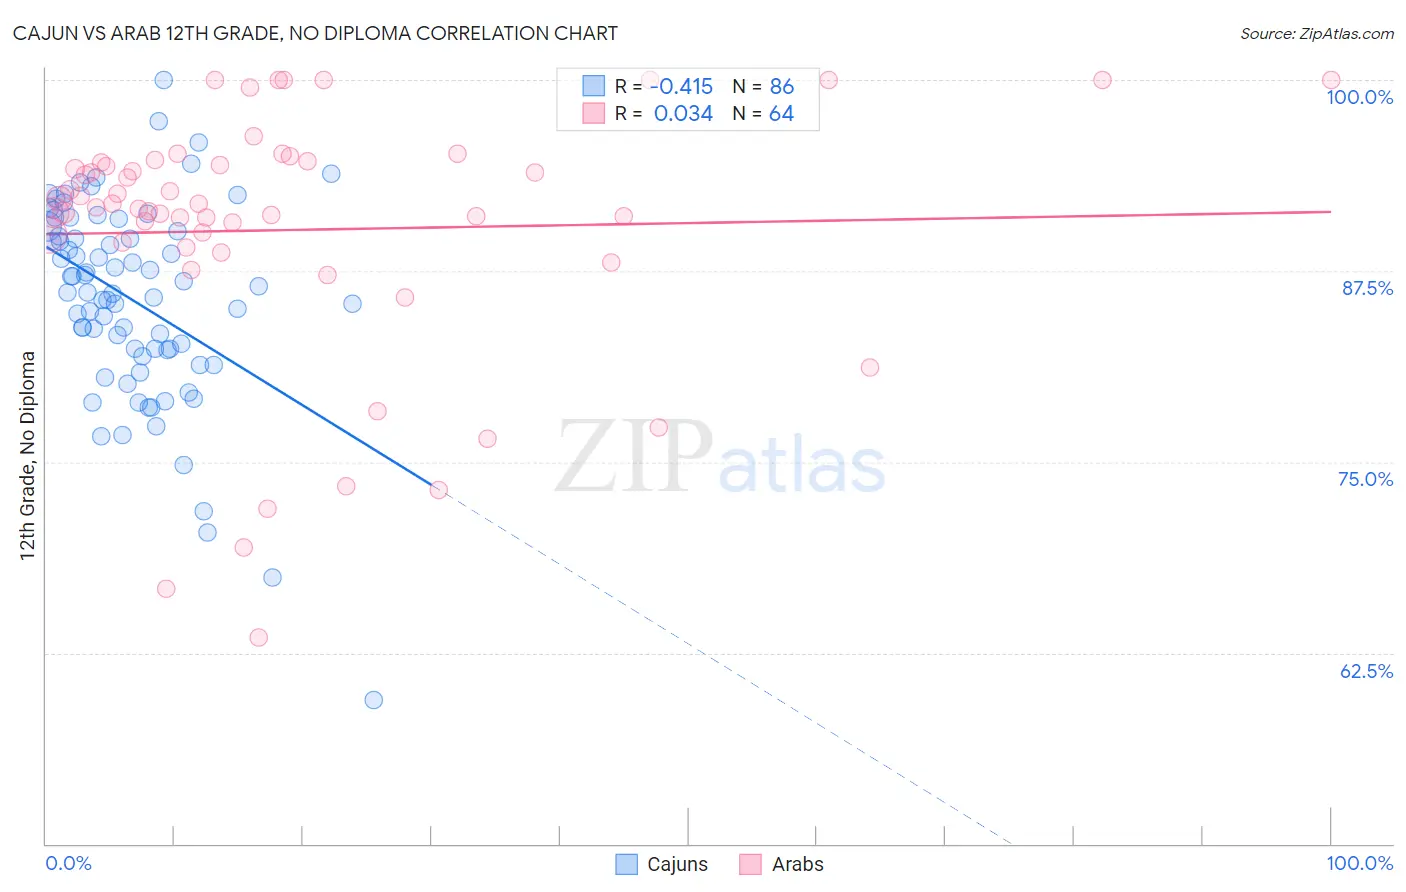
Cajun vs Arab 12th Grade, No Diploma Correlation Chart
The statistical analysis conducted on geographies consisting of 149,713,149 people shows a moderate negative correlation between the proportion of Cajuns and percentage of population with at least 12th grade (no diploma) education in the United States with a correlation coefficient (R) of -0.415 and weighted average of 89.1%. Similarly, the statistical analysis conducted on geographies consisting of 486,870,847 people shows no correlation between the proportion of Arabs and percentage of population with at least 12th grade (no diploma) education in the United States with a correlation coefficient (R) of 0.034 and weighted average of 91.6%, a difference of 2.8%.
12th Grade, No Diploma Correlation Summary
| Measurement | Cajun | Arab |
| Minimum | 59.4% | 63.5% |
| Maximum | 100.0% | 100.0% |
| Range | 40.6% | 36.5% |
| Mean | 85.6% | 90.2% |
| Median | 86.1% | 91.8% |
| Interquartile 25% (IQ1) | 82.3% | 89.2% |
| Interquartile 75% (IQ3) | 90.1% | 94.6% |
| Interquartile Range (IQR) | 7.8% | 5.4% |
| Standard Deviation (Sample) | 6.6% | 8.4% |
| Standard Deviation (Population) | 6.6% | 8.3% |
Similar Demographics by 12th Grade, No Diploma
Demographics Similar to Cajuns by 12th Grade, No Diploma
In terms of 12th grade, no diploma, the demographic groups most similar to Cajuns are Barbadian (89.1%, a difference of 0.020%), Immigrants from Congo (89.0%, a difference of 0.070%), Ute (89.0%, a difference of 0.070%), Immigrants from Barbados (89.0%, a difference of 0.13%), and Malaysian (89.2%, a difference of 0.14%).
| Demographics | Rating | Rank | 12th Grade, No Diploma |
| West Indians | 0.2 /100 | #267 | Tragic 89.3% |
| Immigrants | Trinidad and Tobago | 0.1 /100 | #268 | Tragic 89.3% |
| U.S. Virgin Islanders | 0.1 /100 | #269 | Tragic 89.3% |
| Bangladeshis | 0.1 /100 | #270 | Tragic 89.3% |
| Blacks/African Americans | 0.1 /100 | #271 | Tragic 89.3% |
| Malaysians | 0.1 /100 | #272 | Tragic 89.2% |
| Barbadians | 0.1 /100 | #273 | Tragic 89.1% |
| Cajuns | 0.1 /100 | #274 | Tragic 89.1% |
| Immigrants | Congo | 0.1 /100 | #275 | Tragic 89.0% |
| Ute | 0.1 /100 | #276 | Tragic 89.0% |
| Immigrants | Barbados | 0.0 /100 | #277 | Tragic 89.0% |
| Immigrants | St. Vincent and the Grenadines | 0.0 /100 | #278 | Tragic 88.9% |
| Immigrants | Laos | 0.0 /100 | #279 | Tragic 88.9% |
| Immigrants | Burma/Myanmar | 0.0 /100 | #280 | Tragic 88.9% |
| Cubans | 0.0 /100 | #281 | Tragic 88.9% |
Demographics Similar to Arabs by 12th Grade, No Diploma
In terms of 12th grade, no diploma, the demographic groups most similar to Arabs are Immigrants from Egypt (91.6%, a difference of 0.0%), Alaska Native (91.6%, a difference of 0.020%), Chilean (91.7%, a difference of 0.040%), Immigrants from Poland (91.6%, a difference of 0.040%), and Argentinean (91.6%, a difference of 0.050%).
| Demographics | Rating | Rank | 12th Grade, No Diploma |
| Albanians | 89.3 /100 | #131 | Excellent 91.8% |
| Immigrants | Eastern Asia | 89.3 /100 | #132 | Excellent 91.8% |
| Immigrants | Italy | 88.3 /100 | #133 | Excellent 91.7% |
| Venezuelans | 88.2 /100 | #134 | Excellent 91.7% |
| Immigrants | Bosnia and Herzegovina | 87.3 /100 | #135 | Excellent 91.7% |
| Chileans | 85.8 /100 | #136 | Excellent 91.7% |
| Alaska Natives | 84.9 /100 | #137 | Excellent 91.6% |
| Arabs | 84.1 /100 | #138 | Excellent 91.6% |
| Immigrants | Egypt | 83.9 /100 | #139 | Excellent 91.6% |
| Immigrants | Poland | 82.3 /100 | #140 | Excellent 91.6% |
| Argentineans | 82.0 /100 | #141 | Excellent 91.6% |
| Immigrants | Venezuela | 80.9 /100 | #142 | Excellent 91.6% |
| Immigrants | Argentina | 80.7 /100 | #143 | Excellent 91.6% |
| Immigrants | Spain | 80.1 /100 | #144 | Excellent 91.6% |
| Immigrants | Lebanon | 80.0 /100 | #145 | Excellent 91.6% |