Burmese vs French Canadian Bachelor's Degree
COMPARE
Burmese
French Canadian
Bachelor's Degree
Bachelor's Degree Comparison
Burmese
French Canadians
46.9%
BACHELOR'S DEGREE
100.0/ 100
METRIC RATING
25th/ 347
METRIC RANK
35.6%
BACHELOR'S DEGREE
8.3/ 100
METRIC RATING
223rd/ 347
METRIC RANK
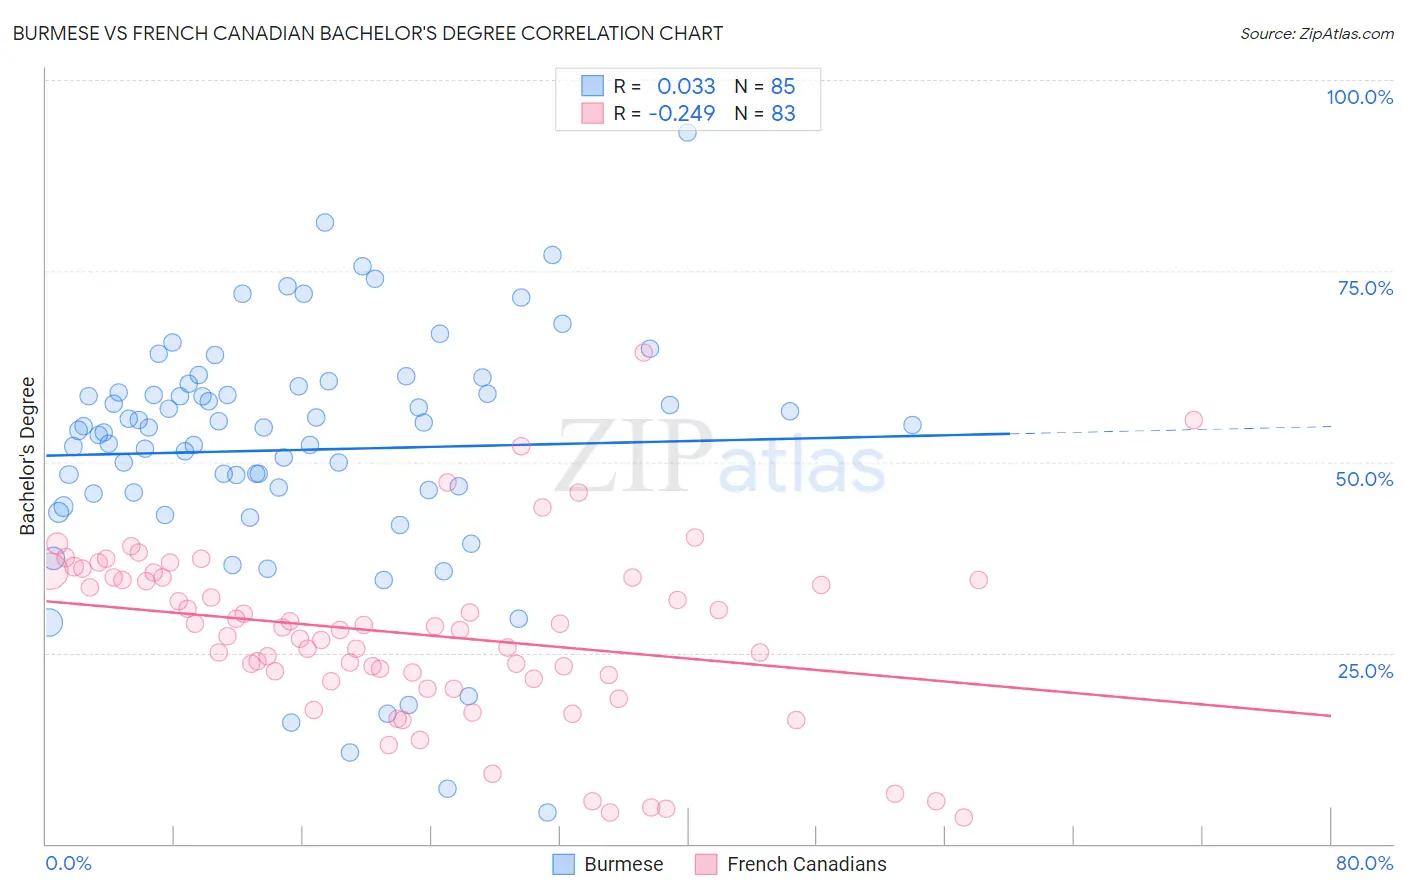
Burmese vs French Canadian Bachelor's Degree Correlation Chart
The statistical analysis conducted on geographies consisting of 465,330,560 people shows no correlation between the proportion of Burmese and percentage of population with at least bachelor's degree education in the United States with a correlation coefficient (R) of 0.033 and weighted average of 46.9%. Similarly, the statistical analysis conducted on geographies consisting of 502,615,411 people shows a weak negative correlation between the proportion of French Canadians and percentage of population with at least bachelor's degree education in the United States with a correlation coefficient (R) of -0.249 and weighted average of 35.6%, a difference of 31.6%.
Bachelor's Degree Correlation Summary
| Measurement | Burmese | French Canadian |
| Minimum | 4.0% | 3.4% |
| Maximum | 93.1% | 64.3% |
| Range | 89.1% | 60.9% |
| Mean | 51.6% | 27.5% |
| Median | 54.4% | 28.0% |
| Interquartile 25% (IQ1) | 45.9% | 21.6% |
| Interquartile 75% (IQ3) | 59.5% | 34.8% |
| Interquartile Range (IQR) | 13.6% | 13.2% |
| Standard Deviation (Sample) | 16.1% | 11.6% |
| Standard Deviation (Population) | 16.0% | 11.5% |
Similar Demographics by Bachelor's Degree
Demographics Similar to Burmese by Bachelor's Degree
In terms of bachelor's degree, the demographic groups most similar to Burmese are Immigrants from Japan (46.8%, a difference of 0.10%), Immigrants from Korea (47.0%, a difference of 0.22%), Immigrants from Sweden (47.0%, a difference of 0.26%), Immigrants from Belgium (47.0%, a difference of 0.35%), and Immigrants from Ireland (47.1%, a difference of 0.55%).
| Demographics | Rating | Rank | Bachelor's Degree |
| Indians (Asian) | 100.0 /100 | #18 | Exceptional 47.4% |
| Cambodians | 100.0 /100 | #19 | Exceptional 47.2% |
| Immigrants | Switzerland | 100.0 /100 | #20 | Exceptional 47.1% |
| Immigrants | Ireland | 100.0 /100 | #21 | Exceptional 47.1% |
| Immigrants | Belgium | 100.0 /100 | #22 | Exceptional 47.0% |
| Immigrants | Sweden | 100.0 /100 | #23 | Exceptional 47.0% |
| Immigrants | Korea | 100.0 /100 | #24 | Exceptional 47.0% |
| Burmese | 100.0 /100 | #25 | Exceptional 46.9% |
| Immigrants | Japan | 100.0 /100 | #26 | Exceptional 46.8% |
| Immigrants | France | 100.0 /100 | #27 | Exceptional 46.4% |
| Turks | 100.0 /100 | #28 | Exceptional 46.2% |
| Israelis | 100.0 /100 | #29 | Exceptional 46.1% |
| Immigrants | Sri Lanka | 100.0 /100 | #30 | Exceptional 46.1% |
| Latvians | 100.0 /100 | #31 | Exceptional 46.1% |
| Immigrants | Turkey | 100.0 /100 | #32 | Exceptional 46.0% |
Demographics Similar to French Canadians by Bachelor's Degree
In terms of bachelor's degree, the demographic groups most similar to French Canadians are Trinidadian and Tobagonian (35.7%, a difference of 0.18%), Immigrants from Barbados (35.5%, a difference of 0.28%), Dutch (35.7%, a difference of 0.32%), Immigrants from Burma/Myanmar (35.5%, a difference of 0.35%), and Portuguese (35.5%, a difference of 0.38%).
| Demographics | Rating | Rank | Bachelor's Degree |
| Barbadians | 13.5 /100 | #216 | Poor 36.1% |
| German Russians | 10.2 /100 | #217 | Poor 35.8% |
| Sub-Saharan Africans | 9.8 /100 | #218 | Tragic 35.8% |
| West Indians | 9.7 /100 | #219 | Tragic 35.8% |
| Spanish | 9.6 /100 | #220 | Tragic 35.8% |
| Dutch | 9.2 /100 | #221 | Tragic 35.7% |
| Trinidadians and Tobagonians | 8.8 /100 | #222 | Tragic 35.7% |
| French Canadians | 8.3 /100 | #223 | Tragic 35.6% |
| Immigrants | Barbados | 7.5 /100 | #224 | Tragic 35.5% |
| Immigrants | Burma/Myanmar | 7.3 /100 | #225 | Tragic 35.5% |
| Portuguese | 7.2 /100 | #226 | Tragic 35.5% |
| Ecuadorians | 6.6 /100 | #227 | Tragic 35.4% |
| Immigrants | Trinidad and Tobago | 6.0 /100 | #228 | Tragic 35.3% |
| Whites/Caucasians | 5.9 /100 | #229 | Tragic 35.3% |
| Immigrants | Grenada | 4.3 /100 | #230 | Tragic 35.0% |