Bulgarian vs Immigrants from Guyana No Schooling Completed
COMPARE
Bulgarian
Immigrants from Guyana
No Schooling Completed
No Schooling Completed Comparison
Bulgarians
Immigrants from Guyana
1.6%
NO SCHOOLING COMPLETED
99.9/ 100
METRIC RATING
42nd/ 347
METRIC RANK
3.1%
NO SCHOOLING COMPLETED
0.0/ 100
METRIC RATING
318th/ 347
METRIC RANK
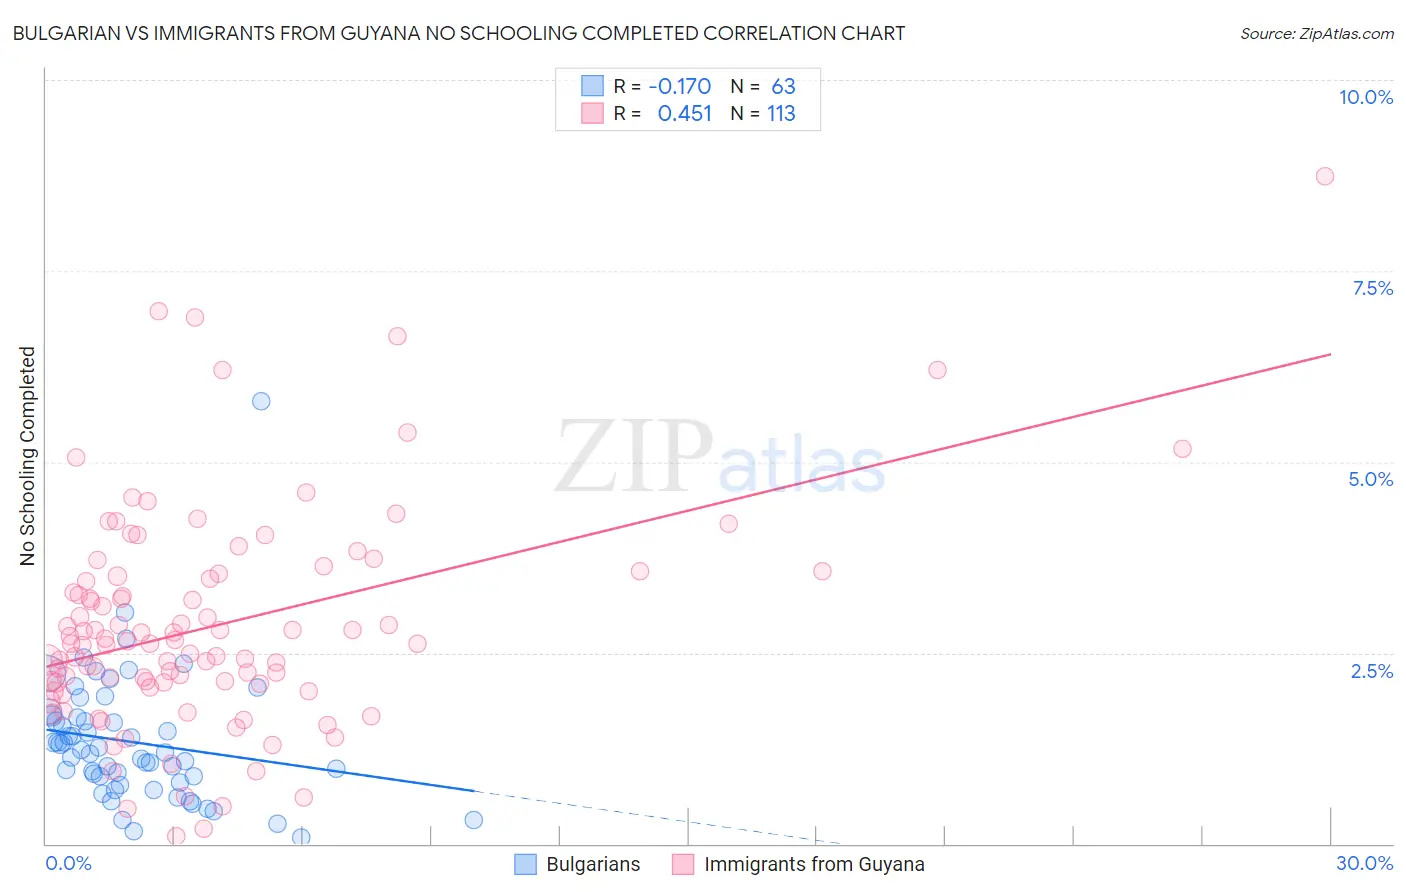
Bulgarian vs Immigrants from Guyana No Schooling Completed Correlation Chart
The statistical analysis conducted on geographies consisting of 204,511,013 people shows a poor negative correlation between the proportion of Bulgarians and percentage of population with no schooling in the United States with a correlation coefficient (R) of -0.170 and weighted average of 1.6%. Similarly, the statistical analysis conducted on geographies consisting of 183,181,054 people shows a moderate positive correlation between the proportion of Immigrants from Guyana and percentage of population with no schooling in the United States with a correlation coefficient (R) of 0.451 and weighted average of 3.1%, a difference of 93.2%.
No Schooling Completed Correlation Summary
| Measurement | Bulgarian | Immigrants from Guyana |
| Minimum | 0.085% | 0.10% |
| Maximum | 5.8% | 8.7% |
| Range | 5.7% | 8.6% |
| Mean | 1.3% | 2.9% |
| Median | 1.2% | 2.6% |
| Interquartile 25% (IQ1) | 0.80% | 2.1% |
| Interquartile 75% (IQ3) | 1.7% | 3.5% |
| Interquartile Range (IQR) | 0.86% | 1.4% |
| Standard Deviation (Sample) | 0.86% | 1.4% |
| Standard Deviation (Population) | 0.86% | 1.4% |
Similar Demographics by No Schooling Completed
Demographics Similar to Bulgarians by No Schooling Completed
In terms of no schooling completed, the demographic groups most similar to Bulgarians are Australian (1.6%, a difference of 0.12%), Estonian (1.6%, a difference of 0.31%), Czechoslovakian (1.6%, a difference of 0.35%), Maltese (1.6%, a difference of 0.44%), and Ottawa (1.6%, a difference of 0.59%).
| Demographics | Rating | Rank | No Schooling Completed |
| Eastern Europeans | 100.0 /100 | #35 | Exceptional 1.6% |
| Aleuts | 99.9 /100 | #36 | Exceptional 1.6% |
| Belgians | 99.9 /100 | #37 | Exceptional 1.6% |
| Northern Europeans | 99.9 /100 | #38 | Exceptional 1.6% |
| Native Hawaiians | 99.9 /100 | #39 | Exceptional 1.6% |
| Luxembourgers | 99.9 /100 | #40 | Exceptional 1.6% |
| Hungarians | 99.9 /100 | #41 | Exceptional 1.6% |
| Bulgarians | 99.9 /100 | #42 | Exceptional 1.6% |
| Australians | 99.9 /100 | #43 | Exceptional 1.6% |
| Estonians | 99.9 /100 | #44 | Exceptional 1.6% |
| Czechoslovakians | 99.9 /100 | #45 | Exceptional 1.6% |
| Maltese | 99.9 /100 | #46 | Exceptional 1.6% |
| Ottawa | 99.9 /100 | #47 | Exceptional 1.6% |
| Immigrants | Scotland | 99.9 /100 | #48 | Exceptional 1.6% |
| Whites/Caucasians | 99.9 /100 | #49 | Exceptional 1.6% |
Demographics Similar to Immigrants from Guyana by No Schooling Completed
In terms of no schooling completed, the demographic groups most similar to Immigrants from Guyana are Cape Verdean (3.1%, a difference of 0.68%), Immigrants from Burma/Myanmar (3.1%, a difference of 0.74%), Immigrants from Bangladesh (3.1%, a difference of 0.78%), Immigrants from Laos (3.1%, a difference of 0.89%), and Immigrants from Ecuador (3.1%, a difference of 1.2%).
| Demographics | Rating | Rank | No Schooling Completed |
| Immigrants | Azores | 0.0 /100 | #311 | Tragic 3.0% |
| Sri Lankans | 0.0 /100 | #312 | Tragic 3.0% |
| Hondurans | 0.0 /100 | #313 | Tragic 3.1% |
| Immigrants | Belize | 0.0 /100 | #314 | Tragic 3.1% |
| Immigrants | Nicaragua | 0.0 /100 | #315 | Tragic 3.1% |
| Immigrants | Ecuador | 0.0 /100 | #316 | Tragic 3.1% |
| Cape Verdeans | 0.0 /100 | #317 | Tragic 3.1% |
| Immigrants | Guyana | 0.0 /100 | #318 | Tragic 3.1% |
| Immigrants | Burma/Myanmar | 0.0 /100 | #319 | Tragic 3.1% |
| Immigrants | Bangladesh | 0.0 /100 | #320 | Tragic 3.1% |
| Immigrants | Laos | 0.0 /100 | #321 | Tragic 3.1% |
| Immigrants | Honduras | 0.0 /100 | #322 | Tragic 3.2% |
| Vietnamese | 0.0 /100 | #323 | Tragic 3.2% |
| Mexican American Indians | 0.0 /100 | #324 | Tragic 3.2% |
| Dominicans | 0.0 /100 | #325 | Tragic 3.2% |