Bulgarian vs Immigrants from Czechoslovakia No Schooling Completed
COMPARE
Bulgarian
Immigrants from Czechoslovakia
No Schooling Completed
No Schooling Completed Comparison
Bulgarians
Immigrants from Czechoslovakia
1.6%
NO SCHOOLING COMPLETED
99.9/ 100
METRIC RATING
42nd/ 347
METRIC RANK
1.8%
NO SCHOOLING COMPLETED
97.9/ 100
METRIC RATING
101st/ 347
METRIC RANK
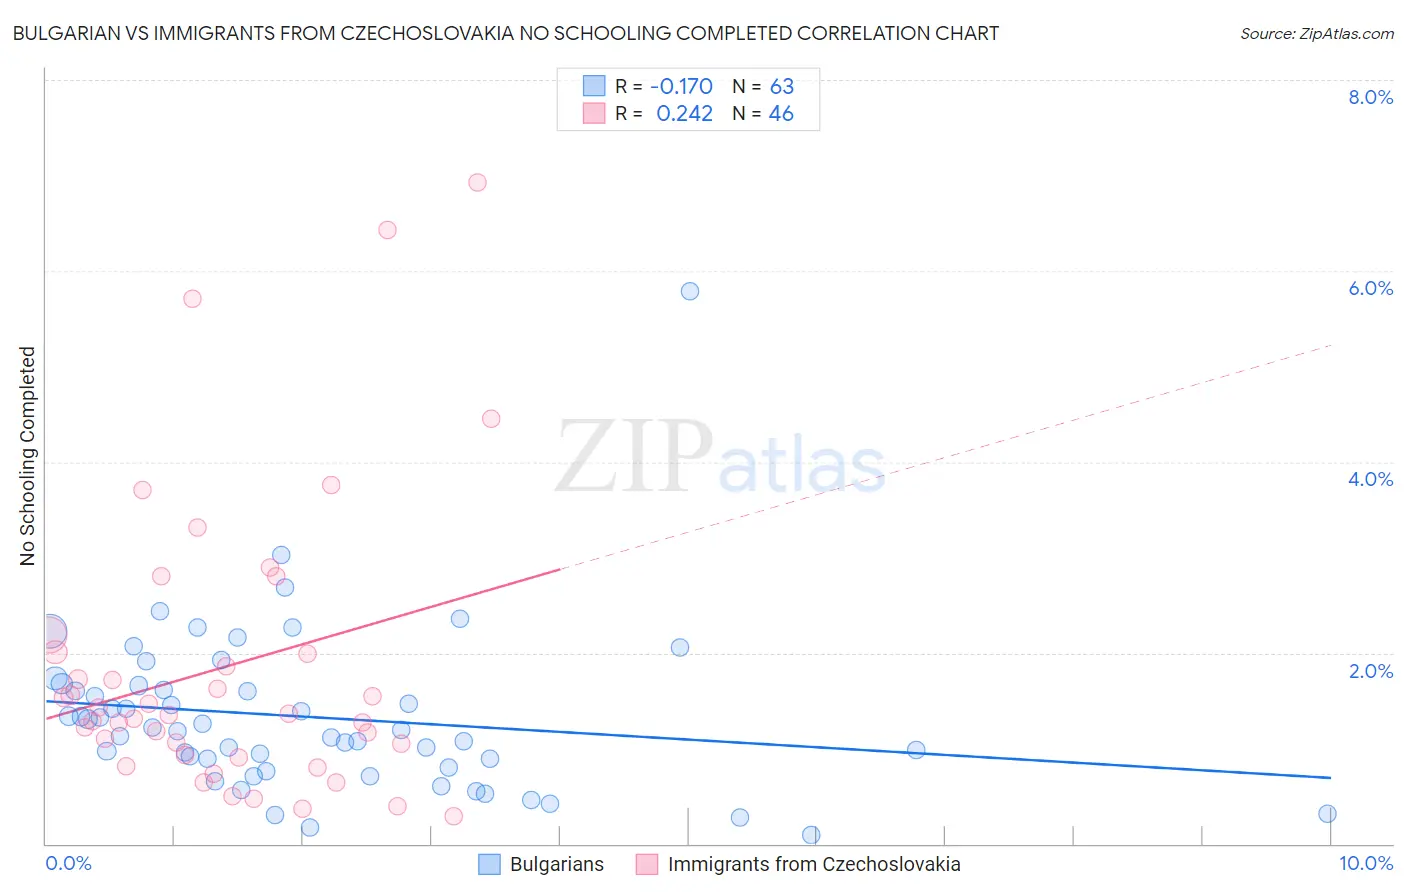
Bulgarian vs Immigrants from Czechoslovakia No Schooling Completed Correlation Chart
The statistical analysis conducted on geographies consisting of 204,511,013 people shows a poor negative correlation between the proportion of Bulgarians and percentage of population with no schooling in the United States with a correlation coefficient (R) of -0.170 and weighted average of 1.6%. Similarly, the statistical analysis conducted on geographies consisting of 194,474,881 people shows a weak positive correlation between the proportion of Immigrants from Czechoslovakia and percentage of population with no schooling in the United States with a correlation coefficient (R) of 0.242 and weighted average of 1.8%, a difference of 12.7%.
No Schooling Completed Correlation Summary
| Measurement | Bulgarian | Immigrants from Czechoslovakia |
| Minimum | 0.085% | 0.29% |
| Maximum | 5.8% | 6.9% |
| Range | 5.7% | 6.6% |
| Mean | 1.3% | 1.9% |
| Median | 1.2% | 1.4% |
| Interquartile 25% (IQ1) | 0.80% | 0.93% |
| Interquartile 75% (IQ3) | 1.7% | 2.0% |
| Interquartile Range (IQR) | 0.86% | 1.1% |
| Standard Deviation (Sample) | 0.86% | 1.5% |
| Standard Deviation (Population) | 0.86% | 1.5% |
Similar Demographics by No Schooling Completed
Demographics Similar to Bulgarians by No Schooling Completed
In terms of no schooling completed, the demographic groups most similar to Bulgarians are Australian (1.6%, a difference of 0.12%), Estonian (1.6%, a difference of 0.31%), Czechoslovakian (1.6%, a difference of 0.35%), Maltese (1.6%, a difference of 0.44%), and Ottawa (1.6%, a difference of 0.59%).
| Demographics | Rating | Rank | No Schooling Completed |
| Eastern Europeans | 100.0 /100 | #35 | Exceptional 1.6% |
| Aleuts | 99.9 /100 | #36 | Exceptional 1.6% |
| Belgians | 99.9 /100 | #37 | Exceptional 1.6% |
| Northern Europeans | 99.9 /100 | #38 | Exceptional 1.6% |
| Native Hawaiians | 99.9 /100 | #39 | Exceptional 1.6% |
| Luxembourgers | 99.9 /100 | #40 | Exceptional 1.6% |
| Hungarians | 99.9 /100 | #41 | Exceptional 1.6% |
| Bulgarians | 99.9 /100 | #42 | Exceptional 1.6% |
| Australians | 99.9 /100 | #43 | Exceptional 1.6% |
| Estonians | 99.9 /100 | #44 | Exceptional 1.6% |
| Czechoslovakians | 99.9 /100 | #45 | Exceptional 1.6% |
| Maltese | 99.9 /100 | #46 | Exceptional 1.6% |
| Ottawa | 99.9 /100 | #47 | Exceptional 1.6% |
| Immigrants | Scotland | 99.9 /100 | #48 | Exceptional 1.6% |
| Whites/Caucasians | 99.9 /100 | #49 | Exceptional 1.6% |
Demographics Similar to Immigrants from Czechoslovakia by No Schooling Completed
In terms of no schooling completed, the demographic groups most similar to Immigrants from Czechoslovakia are Immigrants from Switzerland (1.8%, a difference of 0.0%), Basque (1.8%, a difference of 0.060%), Immigrants from Singapore (1.8%, a difference of 0.30%), Choctaw (1.8%, a difference of 0.49%), and Thai (1.8%, a difference of 0.63%).
| Demographics | Rating | Rank | No Schooling Completed |
| Immigrants | Nonimmigrants | 98.5 /100 | #94 | Exceptional 1.8% |
| Puget Sound Salish | 98.5 /100 | #95 | Exceptional 1.8% |
| Bhutanese | 98.4 /100 | #96 | Exceptional 1.8% |
| Immigrants | Ireland | 98.4 /100 | #97 | Exceptional 1.8% |
| Iranians | 98.2 /100 | #98 | Exceptional 1.8% |
| Choctaw | 98.1 /100 | #99 | Exceptional 1.8% |
| Immigrants | Singapore | 98.0 /100 | #100 | Exceptional 1.8% |
| Immigrants | Czechoslovakia | 97.9 /100 | #101 | Exceptional 1.8% |
| Immigrants | Switzerland | 97.9 /100 | #102 | Exceptional 1.8% |
| Basques | 97.9 /100 | #103 | Exceptional 1.8% |
| Thais | 97.5 /100 | #104 | Exceptional 1.8% |
| German Russians | 97.5 /100 | #105 | Exceptional 1.8% |
| Immigrants | France | 97.3 /100 | #106 | Exceptional 1.8% |
| Yugoslavians | 97.2 /100 | #107 | Exceptional 1.8% |
| Okinawans | 97.1 /100 | #108 | Exceptional 1.8% |