Bulgarian vs Immigrants from Uzbekistan No Schooling Completed
COMPARE
Bulgarian
Immigrants from Uzbekistan
No Schooling Completed
No Schooling Completed Comparison
Bulgarians
Immigrants from Uzbekistan
1.6%
NO SCHOOLING COMPLETED
99.9/ 100
METRIC RATING
42nd/ 347
METRIC RANK
2.6%
NO SCHOOLING COMPLETED
0.1/ 100
METRIC RATING
278th/ 347
METRIC RANK
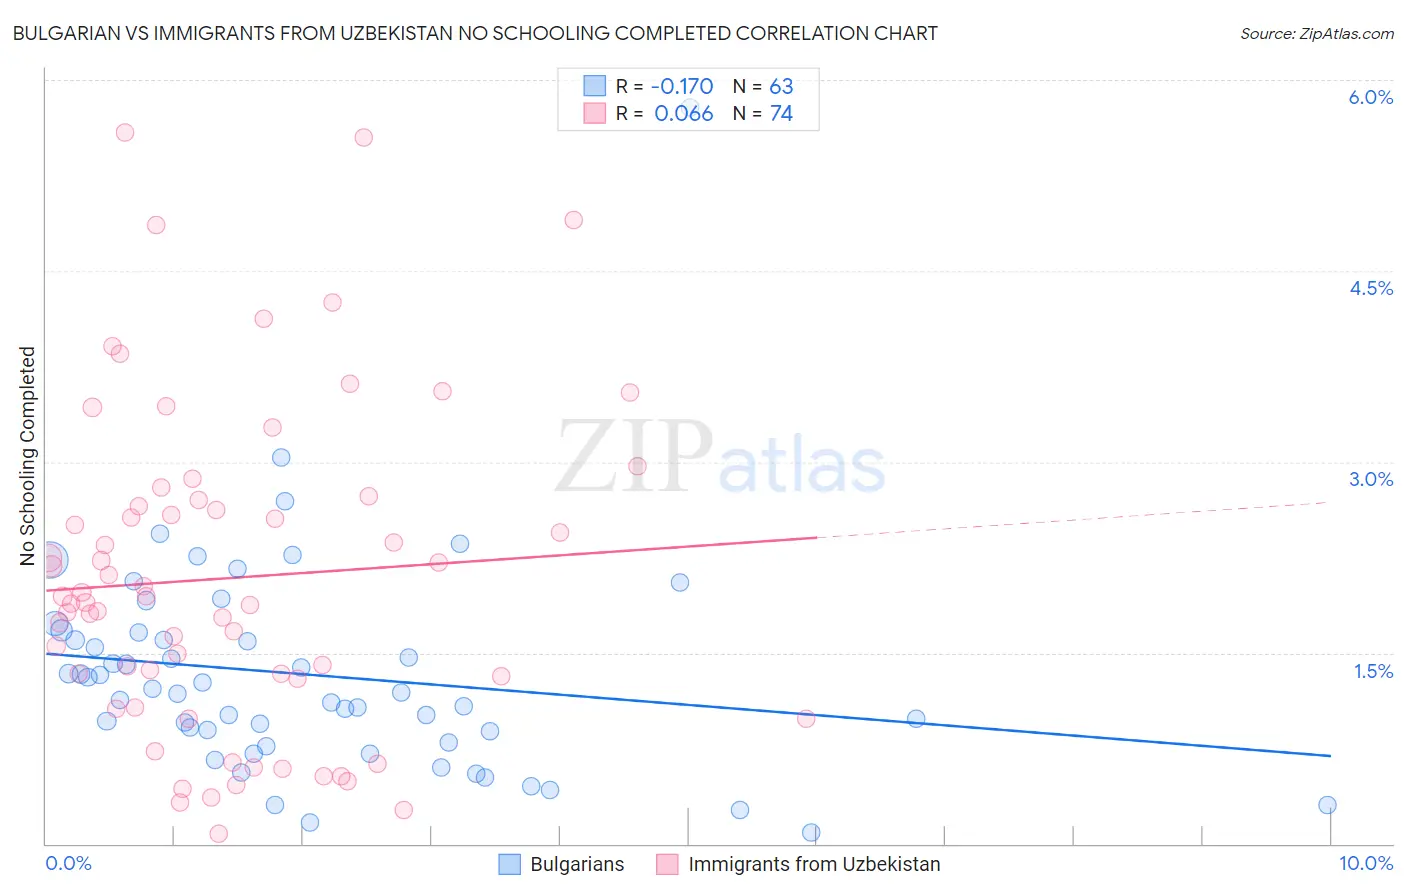
Bulgarian vs Immigrants from Uzbekistan No Schooling Completed Correlation Chart
The statistical analysis conducted on geographies consisting of 204,511,013 people shows a poor negative correlation between the proportion of Bulgarians and percentage of population with no schooling in the United States with a correlation coefficient (R) of -0.170 and weighted average of 1.6%. Similarly, the statistical analysis conducted on geographies consisting of 118,288,407 people shows a slight positive correlation between the proportion of Immigrants from Uzbekistan and percentage of population with no schooling in the United States with a correlation coefficient (R) of 0.066 and weighted average of 2.6%, a difference of 59.9%.
No Schooling Completed Correlation Summary
| Measurement | Bulgarian | Immigrants from Uzbekistan |
| Minimum | 0.085% | 0.076% |
| Maximum | 5.8% | 5.6% |
| Range | 5.7% | 5.5% |
| Mean | 1.3% | 2.1% |
| Median | 1.2% | 1.9% |
| Interquartile 25% (IQ1) | 0.80% | 1.3% |
| Interquartile 75% (IQ3) | 1.7% | 2.7% |
| Interquartile Range (IQR) | 0.86% | 1.4% |
| Standard Deviation (Sample) | 0.86% | 1.3% |
| Standard Deviation (Population) | 0.86% | 1.3% |
Similar Demographics by No Schooling Completed
Demographics Similar to Bulgarians by No Schooling Completed
In terms of no schooling completed, the demographic groups most similar to Bulgarians are Australian (1.6%, a difference of 0.12%), Estonian (1.6%, a difference of 0.31%), Czechoslovakian (1.6%, a difference of 0.35%), Maltese (1.6%, a difference of 0.44%), and Ottawa (1.6%, a difference of 0.59%).
| Demographics | Rating | Rank | No Schooling Completed |
| Eastern Europeans | 100.0 /100 | #35 | Exceptional 1.6% |
| Aleuts | 99.9 /100 | #36 | Exceptional 1.6% |
| Belgians | 99.9 /100 | #37 | Exceptional 1.6% |
| Northern Europeans | 99.9 /100 | #38 | Exceptional 1.6% |
| Native Hawaiians | 99.9 /100 | #39 | Exceptional 1.6% |
| Luxembourgers | 99.9 /100 | #40 | Exceptional 1.6% |
| Hungarians | 99.9 /100 | #41 | Exceptional 1.6% |
| Bulgarians | 99.9 /100 | #42 | Exceptional 1.6% |
| Australians | 99.9 /100 | #43 | Exceptional 1.6% |
| Estonians | 99.9 /100 | #44 | Exceptional 1.6% |
| Czechoslovakians | 99.9 /100 | #45 | Exceptional 1.6% |
| Maltese | 99.9 /100 | #46 | Exceptional 1.6% |
| Ottawa | 99.9 /100 | #47 | Exceptional 1.6% |
| Immigrants | Scotland | 99.9 /100 | #48 | Exceptional 1.6% |
| Whites/Caucasians | 99.9 /100 | #49 | Exceptional 1.6% |
Demographics Similar to Immigrants from Uzbekistan by No Schooling Completed
In terms of no schooling completed, the demographic groups most similar to Immigrants from Uzbekistan are Immigrants from Philippines (2.6%, a difference of 0.20%), Immigrants from Western Africa (2.6%, a difference of 0.25%), Barbadian (2.6%, a difference of 0.55%), Trinidadian and Tobagonian (2.6%, a difference of 0.56%), and Afghan (2.6%, a difference of 0.64%).
| Demographics | Rating | Rank | No Schooling Completed |
| Cubans | 0.2 /100 | #271 | Tragic 2.5% |
| Immigrants | Bolivia | 0.2 /100 | #272 | Tragic 2.5% |
| Immigrants | Cameroon | 0.1 /100 | #273 | Tragic 2.5% |
| Ghanaians | 0.1 /100 | #274 | Tragic 2.6% |
| Immigrants | China | 0.1 /100 | #275 | Tragic 2.6% |
| Immigrants | Western Africa | 0.1 /100 | #276 | Tragic 2.6% |
| Immigrants | Philippines | 0.1 /100 | #277 | Tragic 2.6% |
| Immigrants | Uzbekistan | 0.1 /100 | #278 | Tragic 2.6% |
| Barbadians | 0.1 /100 | #279 | Tragic 2.6% |
| Trinidadians and Tobagonians | 0.1 /100 | #280 | Tragic 2.6% |
| Afghans | 0.1 /100 | #281 | Tragic 2.6% |
| Immigrants | Ghana | 0.1 /100 | #282 | Tragic 2.6% |
| Immigrants | Trinidad and Tobago | 0.0 /100 | #283 | Tragic 2.6% |
| Immigrants | West Indies | 0.0 /100 | #284 | Tragic 2.7% |
| Immigrants | Barbados | 0.0 /100 | #285 | Tragic 2.7% |