Bulgarian vs Puget Sound Salish No Schooling Completed
COMPARE
Bulgarian
Puget Sound Salish
No Schooling Completed
No Schooling Completed Comparison
Bulgarians
Puget Sound Salish
1.6%
NO SCHOOLING COMPLETED
99.9/ 100
METRIC RATING
42nd/ 347
METRIC RANK
1.8%
NO SCHOOLING COMPLETED
98.5/ 100
METRIC RATING
95th/ 347
METRIC RANK
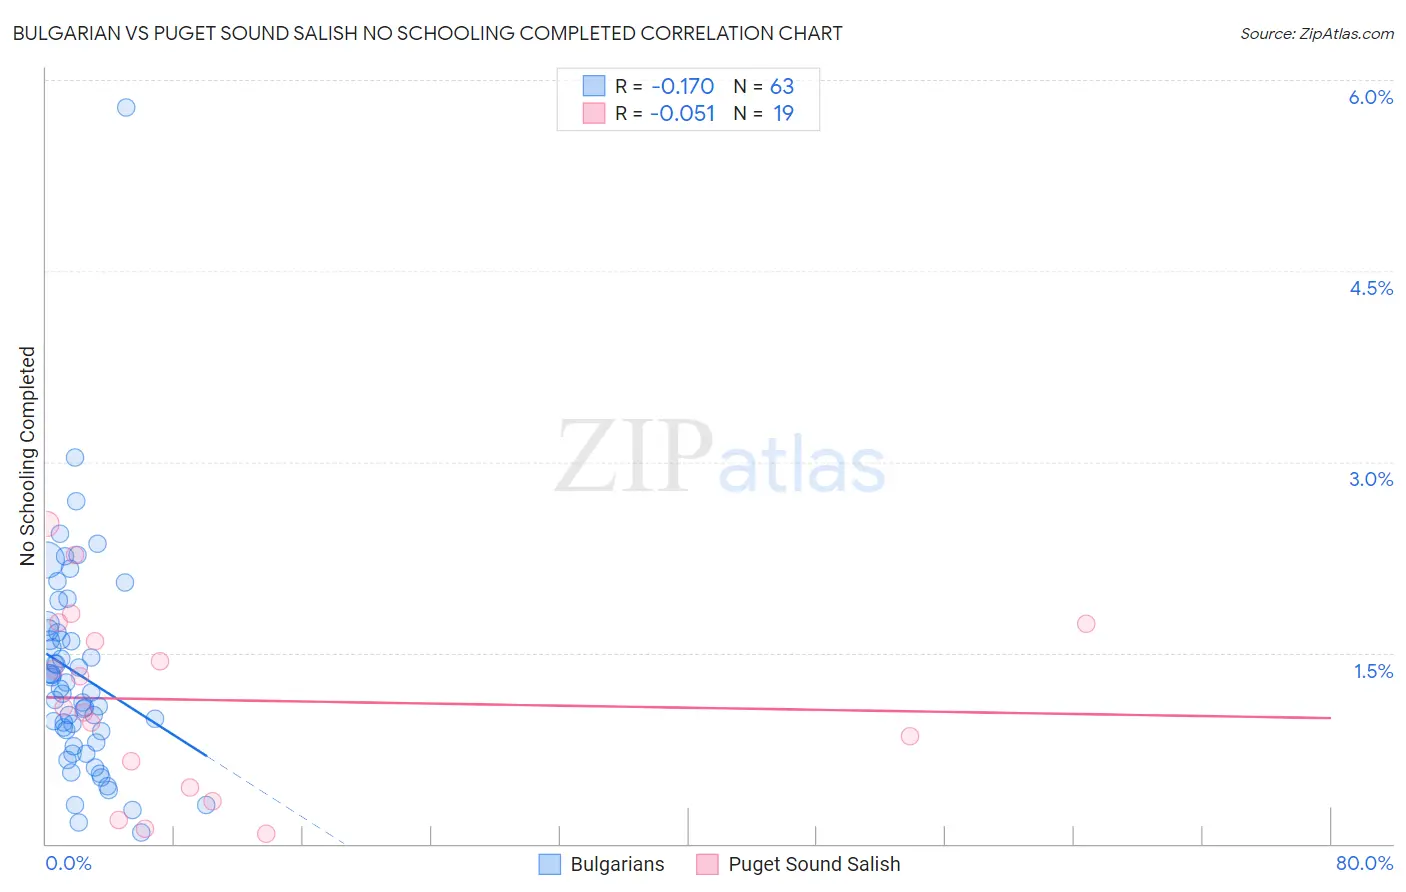
Bulgarian vs Puget Sound Salish No Schooling Completed Correlation Chart
The statistical analysis conducted on geographies consisting of 204,511,013 people shows a poor negative correlation between the proportion of Bulgarians and percentage of population with no schooling in the United States with a correlation coefficient (R) of -0.170 and weighted average of 1.6%. Similarly, the statistical analysis conducted on geographies consisting of 45,937,154 people shows a slight negative correlation between the proportion of Puget Sound Salish and percentage of population with no schooling in the United States with a correlation coefficient (R) of -0.051 and weighted average of 1.8%, a difference of 11.2%.
No Schooling Completed Correlation Summary
| Measurement | Bulgarian | Puget Sound Salish |
| Minimum | 0.085% | 0.082% |
| Maximum | 5.8% | 2.5% |
| Range | 5.7% | 2.4% |
| Mean | 1.3% | 1.1% |
| Median | 1.2% | 1.1% |
| Interquartile 25% (IQ1) | 0.80% | 0.45% |
| Interquartile 75% (IQ3) | 1.7% | 1.7% |
| Interquartile Range (IQR) | 0.86% | 1.3% |
| Standard Deviation (Sample) | 0.86% | 0.72% |
| Standard Deviation (Population) | 0.86% | 0.70% |
Similar Demographics by No Schooling Completed
Demographics Similar to Bulgarians by No Schooling Completed
In terms of no schooling completed, the demographic groups most similar to Bulgarians are Australian (1.6%, a difference of 0.12%), Estonian (1.6%, a difference of 0.31%), Czechoslovakian (1.6%, a difference of 0.35%), Maltese (1.6%, a difference of 0.44%), and Ottawa (1.6%, a difference of 0.59%).
| Demographics | Rating | Rank | No Schooling Completed |
| Eastern Europeans | 100.0 /100 | #35 | Exceptional 1.6% |
| Aleuts | 99.9 /100 | #36 | Exceptional 1.6% |
| Belgians | 99.9 /100 | #37 | Exceptional 1.6% |
| Northern Europeans | 99.9 /100 | #38 | Exceptional 1.6% |
| Native Hawaiians | 99.9 /100 | #39 | Exceptional 1.6% |
| Luxembourgers | 99.9 /100 | #40 | Exceptional 1.6% |
| Hungarians | 99.9 /100 | #41 | Exceptional 1.6% |
| Bulgarians | 99.9 /100 | #42 | Exceptional 1.6% |
| Australians | 99.9 /100 | #43 | Exceptional 1.6% |
| Estonians | 99.9 /100 | #44 | Exceptional 1.6% |
| Czechoslovakians | 99.9 /100 | #45 | Exceptional 1.6% |
| Maltese | 99.9 /100 | #46 | Exceptional 1.6% |
| Ottawa | 99.9 /100 | #47 | Exceptional 1.6% |
| Immigrants | Scotland | 99.9 /100 | #48 | Exceptional 1.6% |
| Whites/Caucasians | 99.9 /100 | #49 | Exceptional 1.6% |
Demographics Similar to Puget Sound Salish by No Schooling Completed
In terms of no schooling completed, the demographic groups most similar to Puget Sound Salish are Nonimmigrants (1.8%, a difference of 0.010%), Bhutanese (1.8%, a difference of 0.23%), Immigrants from Ireland (1.8%, a difference of 0.41%), Turkish (1.8%, a difference of 0.51%), and Iranian (1.8%, a difference of 0.69%).
| Demographics | Rating | Rank | No Schooling Completed |
| Immigrants | Western Europe | 99.2 /100 | #88 | Exceptional 1.8% |
| South Africans | 99.1 /100 | #89 | Exceptional 1.8% |
| Sioux | 99.0 /100 | #90 | Exceptional 1.8% |
| Immigrants | Germany | 99.0 /100 | #91 | Exceptional 1.8% |
| Romanians | 98.8 /100 | #92 | Exceptional 1.8% |
| Turks | 98.7 /100 | #93 | Exceptional 1.8% |
| Immigrants | Nonimmigrants | 98.5 /100 | #94 | Exceptional 1.8% |
| Puget Sound Salish | 98.5 /100 | #95 | Exceptional 1.8% |
| Bhutanese | 98.4 /100 | #96 | Exceptional 1.8% |
| Immigrants | Ireland | 98.4 /100 | #97 | Exceptional 1.8% |
| Iranians | 98.2 /100 | #98 | Exceptional 1.8% |
| Choctaw | 98.1 /100 | #99 | Exceptional 1.8% |
| Immigrants | Singapore | 98.0 /100 | #100 | Exceptional 1.8% |
| Immigrants | Czechoslovakia | 97.9 /100 | #101 | Exceptional 1.8% |
| Immigrants | Switzerland | 97.9 /100 | #102 | Exceptional 1.8% |