Bulgarian vs Puget Sound Salish Bachelor's Degree
COMPARE
Bulgarian
Puget Sound Salish
Bachelor's Degree
Bachelor's Degree Comparison
Bulgarians
Puget Sound Salish
45.3%
BACHELOR'S DEGREE
100.0/ 100
METRIC RATING
38th/ 347
METRIC RANK
30.7%
BACHELOR'S DEGREE
0.0/ 100
METRIC RATING
296th/ 347
METRIC RANK
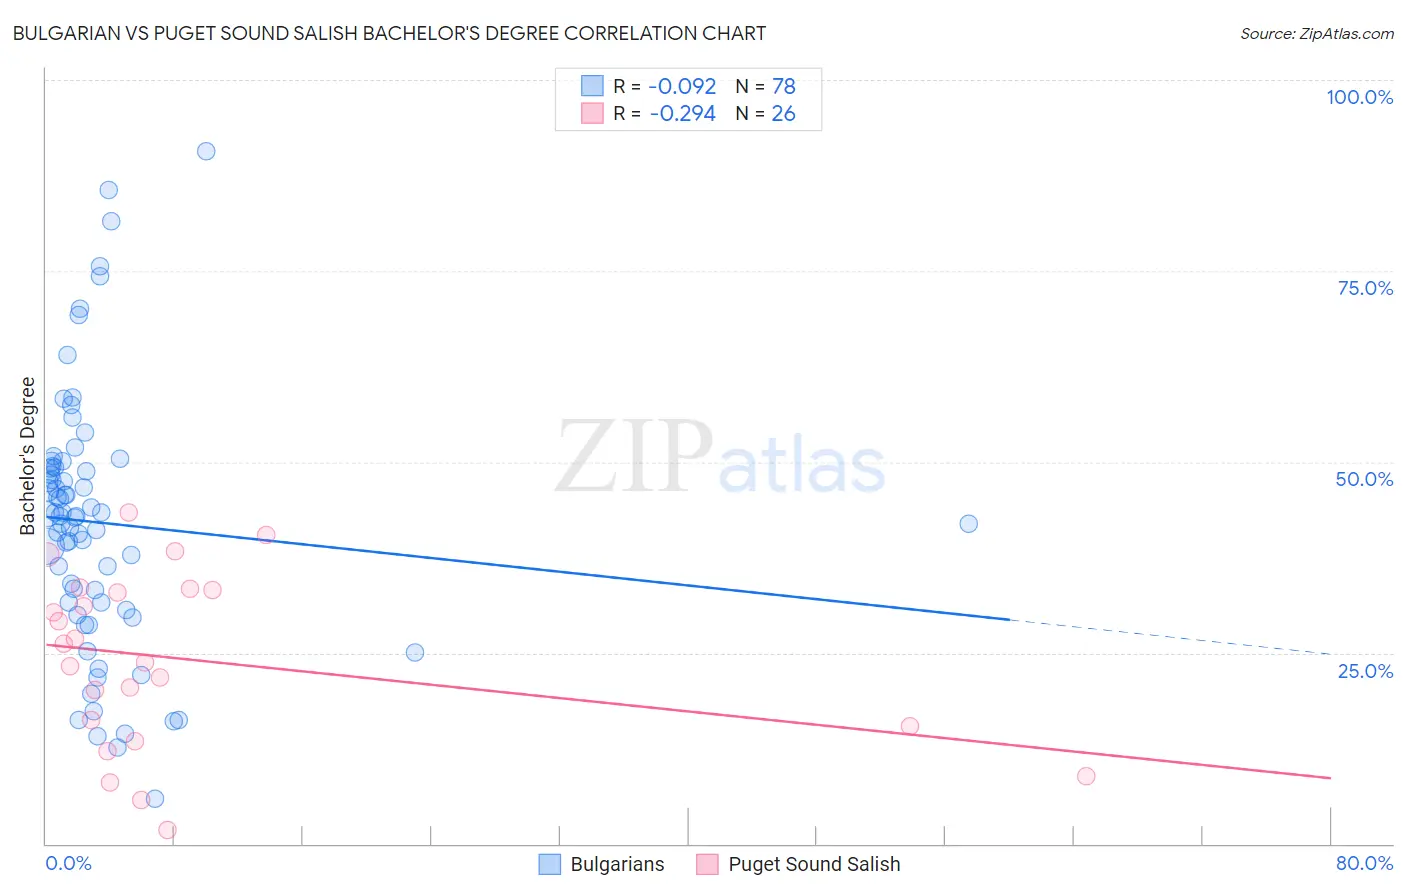
Bulgarian vs Puget Sound Salish Bachelor's Degree Correlation Chart
The statistical analysis conducted on geographies consisting of 205,616,676 people shows a slight negative correlation between the proportion of Bulgarians and percentage of population with at least bachelor's degree education in the United States with a correlation coefficient (R) of -0.092 and weighted average of 45.3%. Similarly, the statistical analysis conducted on geographies consisting of 46,155,865 people shows a weak negative correlation between the proportion of Puget Sound Salish and percentage of population with at least bachelor's degree education in the United States with a correlation coefficient (R) of -0.294 and weighted average of 30.7%, a difference of 47.8%.
Bachelor's Degree Correlation Summary
| Measurement | Bulgarian | Puget Sound Salish |
| Minimum | 5.9% | 1.9% |
| Maximum | 90.7% | 43.4% |
| Range | 84.8% | 41.6% |
| Mean | 42.0% | 24.1% |
| Median | 42.9% | 25.0% |
| Interquartile 25% (IQ1) | 31.5% | 15.4% |
| Interquartile 75% (IQ3) | 49.3% | 33.2% |
| Interquartile Range (IQR) | 17.7% | 17.8% |
| Standard Deviation (Sample) | 16.8% | 11.4% |
| Standard Deviation (Population) | 16.7% | 11.2% |
Similar Demographics by Bachelor's Degree
Demographics Similar to Bulgarians by Bachelor's Degree
In terms of bachelor's degree, the demographic groups most similar to Bulgarians are Russian (45.3%, a difference of 0.090%), Mongolian (45.4%, a difference of 0.24%), Immigrants from Russia (45.4%, a difference of 0.26%), Immigrants from Denmark (45.4%, a difference of 0.28%), and Immigrants from Latvia (45.1%, a difference of 0.33%).
| Demographics | Rating | Rank | Bachelor's Degree |
| Latvians | 100.0 /100 | #31 | Exceptional 46.1% |
| Immigrants | Turkey | 100.0 /100 | #32 | Exceptional 46.0% |
| Immigrants | Northern Europe | 100.0 /100 | #33 | Exceptional 45.6% |
| Immigrants | Denmark | 100.0 /100 | #34 | Exceptional 45.4% |
| Immigrants | Russia | 100.0 /100 | #35 | Exceptional 45.4% |
| Mongolians | 100.0 /100 | #36 | Exceptional 45.4% |
| Russians | 100.0 /100 | #37 | Exceptional 45.3% |
| Bulgarians | 100.0 /100 | #38 | Exceptional 45.3% |
| Immigrants | Latvia | 100.0 /100 | #39 | Exceptional 45.1% |
| Immigrants | Belarus | 100.0 /100 | #40 | Exceptional 45.0% |
| Immigrants | Malaysia | 100.0 /100 | #41 | Exceptional 45.0% |
| Immigrants | Saudi Arabia | 100.0 /100 | #42 | Exceptional 44.8% |
| Immigrants | South Africa | 99.9 /100 | #43 | Exceptional 44.8% |
| Immigrants | Lithuania | 99.9 /100 | #44 | Exceptional 44.6% |
| Immigrants | Kuwait | 99.9 /100 | #45 | Exceptional 44.6% |
Demographics Similar to Puget Sound Salish by Bachelor's Degree
In terms of bachelor's degree, the demographic groups most similar to Puget Sound Salish are Immigrants from Haiti (30.6%, a difference of 0.060%), Immigrants from Dominican Republic (30.7%, a difference of 0.10%), Chippewa (30.6%, a difference of 0.31%), Immigrants from Guatemala (30.8%, a difference of 0.34%), and Cape Verdean (30.9%, a difference of 0.74%).
| Demographics | Rating | Rank | Bachelor's Degree |
| Puerto Ricans | 0.1 /100 | #289 | Tragic 31.0% |
| Immigrants | Honduras | 0.1 /100 | #290 | Tragic 30.9% |
| Blacks/African Americans | 0.1 /100 | #291 | Tragic 30.9% |
| Ute | 0.1 /100 | #292 | Tragic 30.9% |
| Cape Verdeans | 0.1 /100 | #293 | Tragic 30.9% |
| Immigrants | Guatemala | 0.0 /100 | #294 | Tragic 30.8% |
| Immigrants | Dominican Republic | 0.0 /100 | #295 | Tragic 30.7% |
| Puget Sound Salish | 0.0 /100 | #296 | Tragic 30.7% |
| Immigrants | Haiti | 0.0 /100 | #297 | Tragic 30.6% |
| Chippewa | 0.0 /100 | #298 | Tragic 30.6% |
| Chickasaw | 0.0 /100 | #299 | Tragic 30.4% |
| Immigrants | Micronesia | 0.0 /100 | #300 | Tragic 30.4% |
| Immigrants | Cuba | 0.0 /100 | #301 | Tragic 30.3% |
| Mexican American Indians | 0.0 /100 | #302 | Tragic 30.2% |
| Bangladeshis | 0.0 /100 | #303 | Tragic 30.2% |