Bulgarian vs Immigrants from Trinidad and Tobago Births to Unmarried Women
COMPARE
Bulgarian
Immigrants from Trinidad and Tobago
Births to Unmarried Women
Births to Unmarried Women Comparison
Bulgarians
Immigrants from Trinidad and Tobago
27.1%
BIRTHS TO UNMARRIED WOMEN
99.8/ 100
METRIC RATING
30th/ 347
METRIC RANK
36.3%
BIRTHS TO UNMARRIED WOMEN
0.2/ 100
METRIC RATING
256th/ 347
METRIC RANK
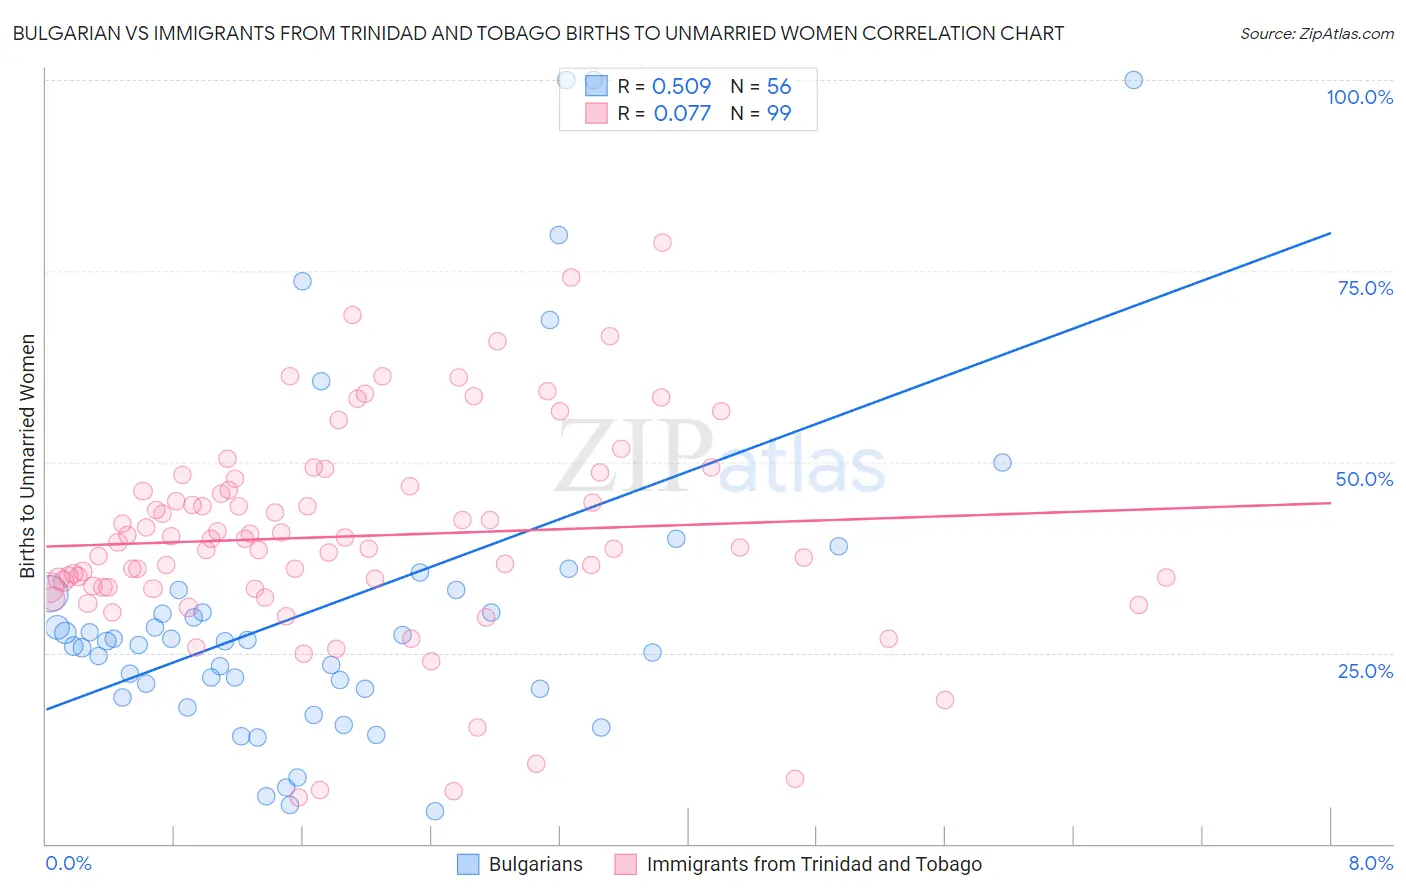
Bulgarian vs Immigrants from Trinidad and Tobago Births to Unmarried Women Correlation Chart
The statistical analysis conducted on geographies consisting of 195,514,672 people shows a substantial positive correlation between the proportion of Bulgarians and percentage of births to unmarried women in the United States with a correlation coefficient (R) of 0.509 and weighted average of 27.1%. Similarly, the statistical analysis conducted on geographies consisting of 215,338,343 people shows a slight positive correlation between the proportion of Immigrants from Trinidad and Tobago and percentage of births to unmarried women in the United States with a correlation coefficient (R) of 0.077 and weighted average of 36.3%, a difference of 34.1%.
Births to Unmarried Women Correlation Summary
| Measurement | Bulgarian | Immigrants from Trinidad and Tobago |
| Minimum | 4.2% | 6.1% |
| Maximum | 100.0% | 78.7% |
| Range | 95.8% | 72.6% |
| Mean | 31.4% | 40.3% |
| Median | 26.5% | 39.5% |
| Interquartile 25% (IQ1) | 20.3% | 33.6% |
| Interquartile 75% (IQ3) | 33.0% | 46.8% |
| Interquartile Range (IQR) | 12.7% | 13.2% |
| Standard Deviation (Sample) | 22.3% | 13.7% |
| Standard Deviation (Population) | 22.1% | 13.7% |
Similar Demographics by Births to Unmarried Women
Demographics Similar to Bulgarians by Births to Unmarried Women
In terms of births to unmarried women, the demographic groups most similar to Bulgarians are Cypriot (27.0%, a difference of 0.16%), Immigrants from Iraq (27.1%, a difference of 0.29%), Immigrants from Russia (27.1%, a difference of 0.32%), Immigrants from Sri Lanka (27.2%, a difference of 0.39%), and Immigrants from Pakistan (27.2%, a difference of 0.43%).
| Demographics | Rating | Rank | Births to Unmarried Women |
| Immigrants | Japan | 99.9 /100 | #23 | Exceptional 26.4% |
| Immigrants | Australia | 99.9 /100 | #24 | Exceptional 26.6% |
| Cambodians | 99.9 /100 | #25 | Exceptional 26.7% |
| Asians | 99.9 /100 | #26 | Exceptional 26.8% |
| Immigrants | Asia | 99.9 /100 | #27 | Exceptional 26.8% |
| Okinawans | 99.8 /100 | #28 | Exceptional 26.9% |
| Cypriots | 99.8 /100 | #29 | Exceptional 27.0% |
| Bulgarians | 99.8 /100 | #30 | Exceptional 27.1% |
| Immigrants | Iraq | 99.8 /100 | #31 | Exceptional 27.1% |
| Immigrants | Russia | 99.8 /100 | #32 | Exceptional 27.1% |
| Immigrants | Sri Lanka | 99.8 /100 | #33 | Exceptional 27.2% |
| Immigrants | Pakistan | 99.8 /100 | #34 | Exceptional 27.2% |
| Immigrants | Ireland | 99.7 /100 | #35 | Exceptional 27.2% |
| Immigrants | Western Asia | 99.7 /100 | #36 | Exceptional 27.2% |
| Immigrants | Ukraine | 99.7 /100 | #37 | Exceptional 27.2% |
Demographics Similar to Immigrants from Trinidad and Tobago by Births to Unmarried Women
In terms of births to unmarried women, the demographic groups most similar to Immigrants from Trinidad and Tobago are Chickasaw (36.3%, a difference of 0.0%), Immigrants from Grenada (36.3%, a difference of 0.030%), Potawatomi (36.2%, a difference of 0.14%), American (36.4%, a difference of 0.31%), and Immigrants from Portugal (36.2%, a difference of 0.36%).
| Demographics | Rating | Rank | Births to Unmarried Women |
| Bermudans | 0.6 /100 | #249 | Tragic 35.5% |
| Mexican American Indians | 0.4 /100 | #250 | Tragic 35.7% |
| Immigrants | Western Africa | 0.3 /100 | #251 | Tragic 36.0% |
| Salvadorans | 0.3 /100 | #252 | Tragic 36.0% |
| Immigrants | Portugal | 0.2 /100 | #253 | Tragic 36.2% |
| Potawatomi | 0.2 /100 | #254 | Tragic 36.2% |
| Chickasaw | 0.2 /100 | #255 | Tragic 36.3% |
| Immigrants | Trinidad and Tobago | 0.2 /100 | #256 | Tragic 36.3% |
| Immigrants | Grenada | 0.2 /100 | #257 | Tragic 36.3% |
| Americans | 0.2 /100 | #258 | Tragic 36.4% |
| Immigrants | El Salvador | 0.2 /100 | #259 | Tragic 36.4% |
| Ottawa | 0.2 /100 | #260 | Tragic 36.5% |
| Trinidadians and Tobagonians | 0.2 /100 | #261 | Tragic 36.5% |
| French American Indians | 0.1 /100 | #262 | Tragic 36.6% |
| Nicaraguans | 0.1 /100 | #263 | Tragic 36.6% |