Bulgarian vs Apache Bachelor's Degree
COMPARE
Bulgarian
Apache
Bachelor's Degree
Bachelor's Degree Comparison
Bulgarians
Apache
45.3%
BACHELOR'S DEGREE
100.0/ 100
METRIC RATING
38th/ 347
METRIC RANK
28.3%
BACHELOR'S DEGREE
0.0/ 100
METRIC RATING
326th/ 347
METRIC RANK
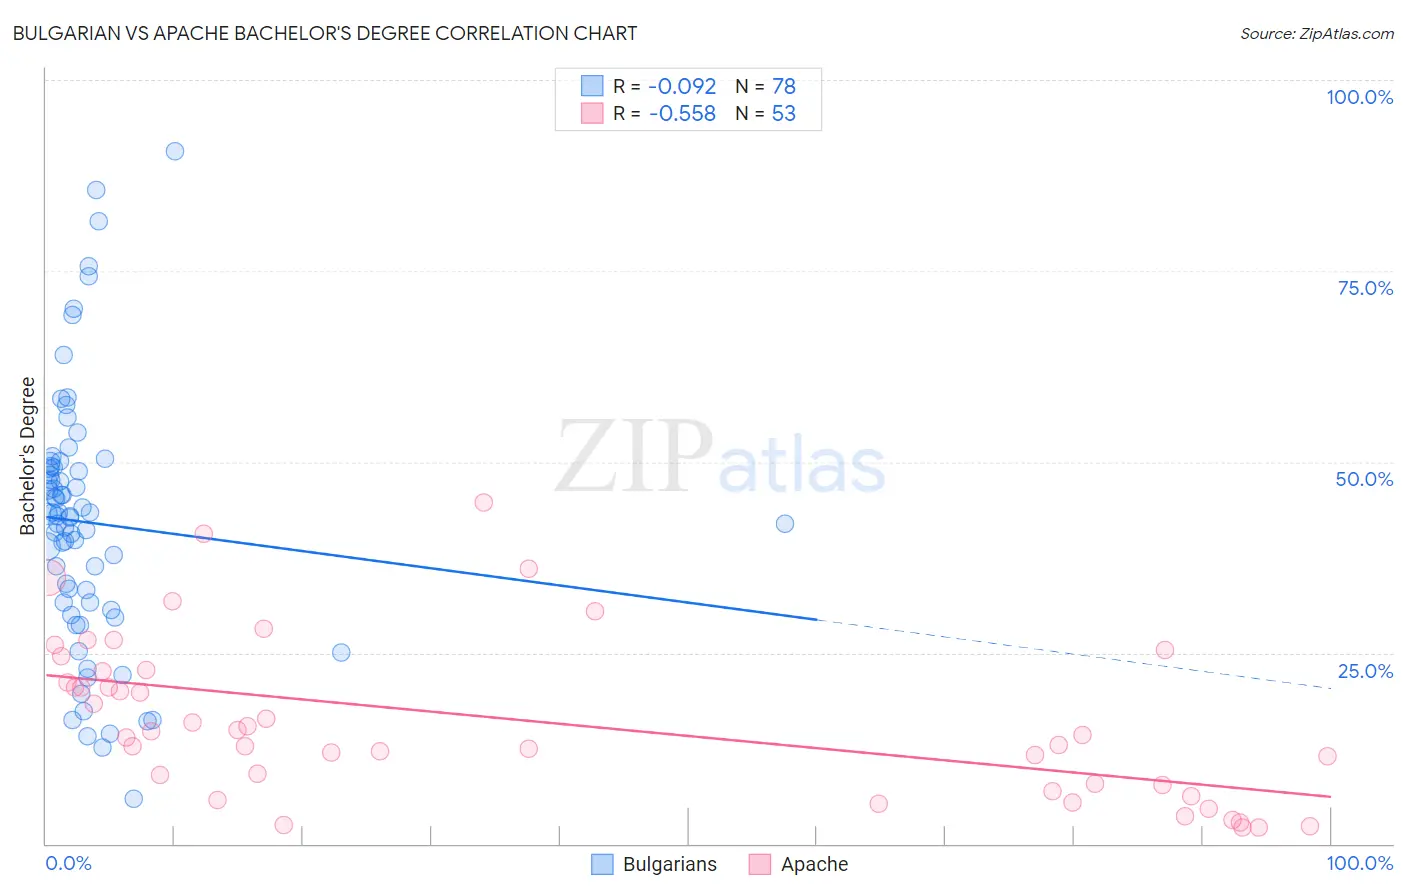
Bulgarian vs Apache Bachelor's Degree Correlation Chart
The statistical analysis conducted on geographies consisting of 205,616,676 people shows a slight negative correlation between the proportion of Bulgarians and percentage of population with at least bachelor's degree education in the United States with a correlation coefficient (R) of -0.092 and weighted average of 45.3%. Similarly, the statistical analysis conducted on geographies consisting of 231,132,422 people shows a substantial negative correlation between the proportion of Apache and percentage of population with at least bachelor's degree education in the United States with a correlation coefficient (R) of -0.558 and weighted average of 28.3%, a difference of 60.2%.
Bachelor's Degree Correlation Summary
| Measurement | Bulgarian | Apache |
| Minimum | 5.9% | 2.1% |
| Maximum | 90.7% | 44.7% |
| Range | 84.8% | 42.5% |
| Mean | 42.0% | 16.1% |
| Median | 42.9% | 14.3% |
| Interquartile 25% (IQ1) | 31.5% | 7.3% |
| Interquartile 75% (IQ3) | 49.3% | 22.7% |
| Interquartile Range (IQR) | 17.7% | 15.4% |
| Standard Deviation (Sample) | 16.8% | 10.5% |
| Standard Deviation (Population) | 16.7% | 10.4% |
Similar Demographics by Bachelor's Degree
Demographics Similar to Bulgarians by Bachelor's Degree
In terms of bachelor's degree, the demographic groups most similar to Bulgarians are Russian (45.3%, a difference of 0.090%), Mongolian (45.4%, a difference of 0.24%), Immigrants from Russia (45.4%, a difference of 0.26%), Immigrants from Denmark (45.4%, a difference of 0.28%), and Immigrants from Latvia (45.1%, a difference of 0.33%).
| Demographics | Rating | Rank | Bachelor's Degree |
| Latvians | 100.0 /100 | #31 | Exceptional 46.1% |
| Immigrants | Turkey | 100.0 /100 | #32 | Exceptional 46.0% |
| Immigrants | Northern Europe | 100.0 /100 | #33 | Exceptional 45.6% |
| Immigrants | Denmark | 100.0 /100 | #34 | Exceptional 45.4% |
| Immigrants | Russia | 100.0 /100 | #35 | Exceptional 45.4% |
| Mongolians | 100.0 /100 | #36 | Exceptional 45.4% |
| Russians | 100.0 /100 | #37 | Exceptional 45.3% |
| Bulgarians | 100.0 /100 | #38 | Exceptional 45.3% |
| Immigrants | Latvia | 100.0 /100 | #39 | Exceptional 45.1% |
| Immigrants | Belarus | 100.0 /100 | #40 | Exceptional 45.0% |
| Immigrants | Malaysia | 100.0 /100 | #41 | Exceptional 45.0% |
| Immigrants | Saudi Arabia | 100.0 /100 | #42 | Exceptional 44.8% |
| Immigrants | South Africa | 99.9 /100 | #43 | Exceptional 44.8% |
| Immigrants | Lithuania | 99.9 /100 | #44 | Exceptional 44.6% |
| Immigrants | Kuwait | 99.9 /100 | #45 | Exceptional 44.6% |
Demographics Similar to Apache by Bachelor's Degree
In terms of bachelor's degree, the demographic groups most similar to Apache are Pennsylvania German (28.4%, a difference of 0.39%), Paiute (28.1%, a difference of 0.67%), Dutch West Indian (28.5%, a difference of 0.84%), Fijian (28.7%, a difference of 1.6%), and Tsimshian (28.8%, a difference of 1.7%).
| Demographics | Rating | Rank | Bachelor's Degree |
| Creek | 0.0 /100 | #319 | Tragic 28.9% |
| Kiowa | 0.0 /100 | #320 | Tragic 28.8% |
| Alaskan Athabascans | 0.0 /100 | #321 | Tragic 28.8% |
| Tsimshian | 0.0 /100 | #322 | Tragic 28.8% |
| Fijians | 0.0 /100 | #323 | Tragic 28.7% |
| Dutch West Indians | 0.0 /100 | #324 | Tragic 28.5% |
| Pennsylvania Germans | 0.0 /100 | #325 | Tragic 28.4% |
| Apache | 0.0 /100 | #326 | Tragic 28.3% |
| Paiute | 0.0 /100 | #327 | Tragic 28.1% |
| Crow | 0.0 /100 | #328 | Tragic 27.7% |
| Immigrants | Central America | 0.0 /100 | #329 | Tragic 27.5% |
| Spanish American Indians | 0.0 /100 | #330 | Tragic 27.5% |
| Immigrants | Azores | 0.0 /100 | #331 | Tragic 27.3% |
| Menominee | 0.0 /100 | #332 | Tragic 27.3% |
| Mexicans | 0.0 /100 | #333 | Tragic 27.1% |