British West Indian vs Immigrants from Nicaragua College, 1 year or more
COMPARE
British West Indian
Immigrants from Nicaragua
College, 1 year or more
College, 1 year or more Comparison
British West Indians
Immigrants from Nicaragua
54.5%
COLLEGE, 1 YEAR OR MORE
0.2/ 100
METRIC RATING
268th/ 347
METRIC RANK
52.4%
COLLEGE, 1 YEAR OR MORE
0.0/ 100
METRIC RATING
299th/ 347
METRIC RANK
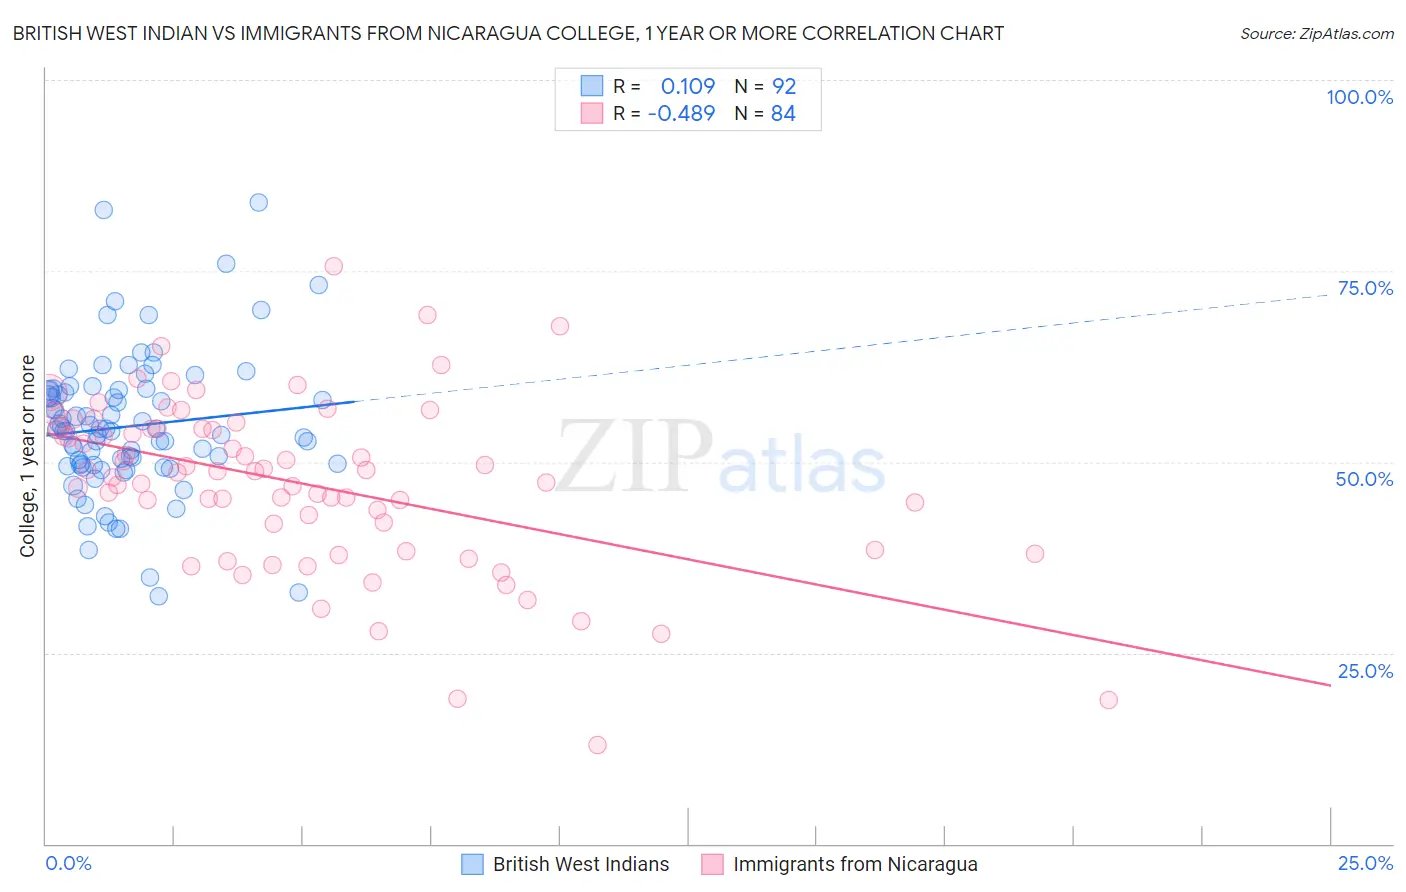
British West Indian vs Immigrants from Nicaragua College, 1 year or more Correlation Chart
The statistical analysis conducted on geographies consisting of 152,694,627 people shows a poor positive correlation between the proportion of British West Indians and percentage of population with at least college, 1 year or more education in the United States with a correlation coefficient (R) of 0.109 and weighted average of 54.5%. Similarly, the statistical analysis conducted on geographies consisting of 236,341,850 people shows a moderate negative correlation between the proportion of Immigrants from Nicaragua and percentage of population with at least college, 1 year or more education in the United States with a correlation coefficient (R) of -0.489 and weighted average of 52.4%, a difference of 4.1%.
College, 1 year or more Correlation Summary
| Measurement | British West Indian | Immigrants from Nicaragua |
| Minimum | 32.4% | 13.0% |
| Maximum | 84.0% | 75.6% |
| Range | 51.6% | 62.6% |
| Mean | 54.6% | 47.2% |
| Median | 54.1% | 48.6% |
| Interquartile 25% (IQ1) | 49.6% | 40.2% |
| Interquartile 75% (IQ3) | 59.2% | 54.4% |
| Interquartile Range (IQR) | 9.6% | 14.2% |
| Standard Deviation (Sample) | 9.2% | 11.2% |
| Standard Deviation (Population) | 9.1% | 11.1% |
Similar Demographics by College, 1 year or more
Demographics Similar to British West Indians by College, 1 year or more
In terms of college, 1 year or more, the demographic groups most similar to British West Indians are Bangladeshi (54.5%, a difference of 0.030%), Crow (54.5%, a difference of 0.070%), Bahamian (54.5%, a difference of 0.090%), Comanche (54.4%, a difference of 0.14%), and Blackfeet (54.6%, a difference of 0.16%).
| Demographics | Rating | Rank | College, 1 year or more |
| Ottawa | 0.3 /100 | #261 | Tragic 54.9% |
| Immigrants | St. Vincent and the Grenadines | 0.3 /100 | #262 | Tragic 54.8% |
| U.S. Virgin Islanders | 0.3 /100 | #263 | Tragic 54.8% |
| Immigrants | Micronesia | 0.3 /100 | #264 | Tragic 54.8% |
| Immigrants | Laos | 0.2 /100 | #265 | Tragic 54.7% |
| Potawatomi | 0.2 /100 | #266 | Tragic 54.6% |
| Blackfeet | 0.2 /100 | #267 | Tragic 54.6% |
| British West Indians | 0.2 /100 | #268 | Tragic 54.5% |
| Bangladeshis | 0.2 /100 | #269 | Tragic 54.5% |
| Crow | 0.2 /100 | #270 | Tragic 54.5% |
| Bahamians | 0.2 /100 | #271 | Tragic 54.5% |
| Comanche | 0.2 /100 | #272 | Tragic 54.4% |
| Immigrants | Grenada | 0.2 /100 | #273 | Tragic 54.4% |
| Belizeans | 0.2 /100 | #274 | Tragic 54.4% |
| Americans | 0.2 /100 | #275 | Tragic 54.4% |
Demographics Similar to Immigrants from Nicaragua by College, 1 year or more
In terms of college, 1 year or more, the demographic groups most similar to Immigrants from Nicaragua are Choctaw (52.3%, a difference of 0.040%), Haitian (52.3%, a difference of 0.10%), Puerto Rican (52.2%, a difference of 0.23%), Creek (52.2%, a difference of 0.30%), and Immigrants from Dominica (52.5%, a difference of 0.34%).
| Demographics | Rating | Rank | College, 1 year or more |
| Chickasaw | 0.0 /100 | #292 | Tragic 53.3% |
| Blacks/African Americans | 0.0 /100 | #293 | Tragic 53.3% |
| Cherokee | 0.0 /100 | #294 | Tragic 53.2% |
| Yaqui | 0.0 /100 | #295 | Tragic 53.2% |
| Sioux | 0.0 /100 | #296 | Tragic 53.0% |
| Paiute | 0.0 /100 | #297 | Tragic 52.9% |
| Immigrants | Dominica | 0.0 /100 | #298 | Tragic 52.5% |
| Immigrants | Nicaragua | 0.0 /100 | #299 | Tragic 52.4% |
| Choctaw | 0.0 /100 | #300 | Tragic 52.3% |
| Haitians | 0.0 /100 | #301 | Tragic 52.3% |
| Puerto Ricans | 0.0 /100 | #302 | Tragic 52.2% |
| Creek | 0.0 /100 | #303 | Tragic 52.2% |
| Central Americans | 0.0 /100 | #304 | Tragic 52.1% |
| Seminole | 0.0 /100 | #305 | Tragic 52.1% |
| Mexican American Indians | 0.0 /100 | #306 | Tragic 51.9% |