British West Indian vs Tsimshian College, 1 year or more
COMPARE
British West Indian
Tsimshian
College, 1 year or more
College, 1 year or more Comparison
British West Indians
Tsimshian
54.5%
COLLEGE, 1 YEAR OR MORE
0.2/ 100
METRIC RATING
268th/ 347
METRIC RANK
57.9%
COLLEGE, 1 YEAR OR MORE
13.5/ 100
METRIC RATING
210th/ 347
METRIC RANK
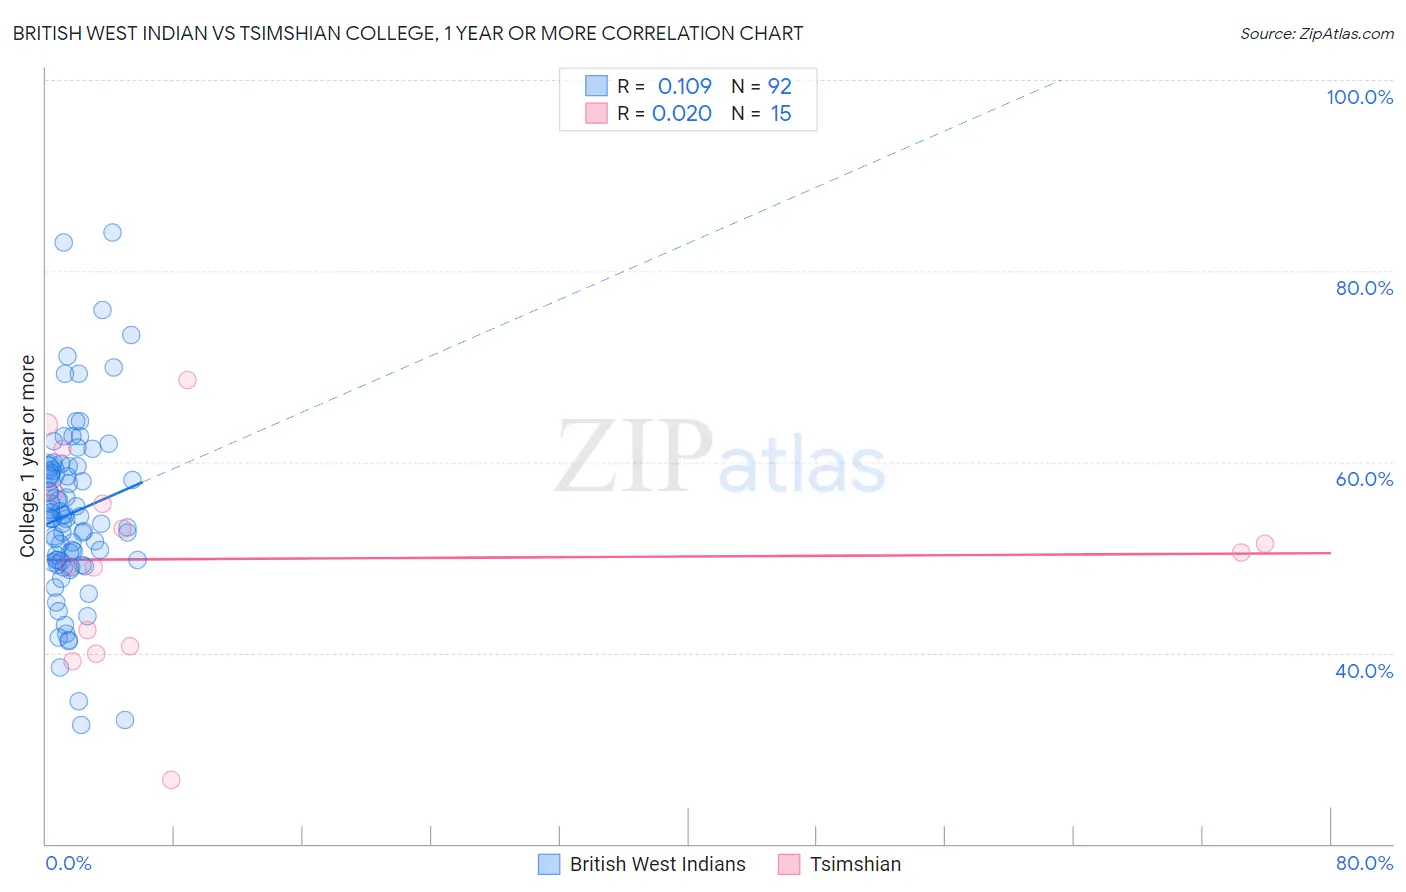
British West Indian vs Tsimshian College, 1 year or more Correlation Chart
The statistical analysis conducted on geographies consisting of 152,694,627 people shows a poor positive correlation between the proportion of British West Indians and percentage of population with at least college, 1 year or more education in the United States with a correlation coefficient (R) of 0.109 and weighted average of 54.5%. Similarly, the statistical analysis conducted on geographies consisting of 15,626,544 people shows no correlation between the proportion of Tsimshian and percentage of population with at least college, 1 year or more education in the United States with a correlation coefficient (R) of 0.020 and weighted average of 57.9%, a difference of 6.3%.
College, 1 year or more Correlation Summary
| Measurement | British West Indian | Tsimshian |
| Minimum | 32.4% | 26.7% |
| Maximum | 84.0% | 68.6% |
| Range | 51.6% | 41.9% |
| Mean | 54.6% | 49.9% |
| Median | 54.1% | 50.5% |
| Interquartile 25% (IQ1) | 49.6% | 40.7% |
| Interquartile 75% (IQ3) | 59.2% | 56.8% |
| Interquartile Range (IQR) | 9.6% | 16.1% |
| Standard Deviation (Sample) | 9.2% | 10.9% |
| Standard Deviation (Population) | 9.1% | 10.6% |
Similar Demographics by College, 1 year or more
Demographics Similar to British West Indians by College, 1 year or more
In terms of college, 1 year or more, the demographic groups most similar to British West Indians are Bangladeshi (54.5%, a difference of 0.030%), Crow (54.5%, a difference of 0.070%), Bahamian (54.5%, a difference of 0.090%), Comanche (54.4%, a difference of 0.14%), and Blackfeet (54.6%, a difference of 0.16%).
| Demographics | Rating | Rank | College, 1 year or more |
| Ottawa | 0.3 /100 | #261 | Tragic 54.9% |
| Immigrants | St. Vincent and the Grenadines | 0.3 /100 | #262 | Tragic 54.8% |
| U.S. Virgin Islanders | 0.3 /100 | #263 | Tragic 54.8% |
| Immigrants | Micronesia | 0.3 /100 | #264 | Tragic 54.8% |
| Immigrants | Laos | 0.2 /100 | #265 | Tragic 54.7% |
| Potawatomi | 0.2 /100 | #266 | Tragic 54.6% |
| Blackfeet | 0.2 /100 | #267 | Tragic 54.6% |
| British West Indians | 0.2 /100 | #268 | Tragic 54.5% |
| Bangladeshis | 0.2 /100 | #269 | Tragic 54.5% |
| Crow | 0.2 /100 | #270 | Tragic 54.5% |
| Bahamians | 0.2 /100 | #271 | Tragic 54.5% |
| Comanche | 0.2 /100 | #272 | Tragic 54.4% |
| Immigrants | Grenada | 0.2 /100 | #273 | Tragic 54.4% |
| Belizeans | 0.2 /100 | #274 | Tragic 54.4% |
| Americans | 0.2 /100 | #275 | Tragic 54.4% |
Demographics Similar to Tsimshian by College, 1 year or more
In terms of college, 1 year or more, the demographic groups most similar to Tsimshian are Immigrants from Nigeria (57.9%, a difference of 0.020%), Immigrants from Middle Africa (58.0%, a difference of 0.060%), Immigrants from Uruguay (58.1%, a difference of 0.19%), Immigrants from Senegal (57.8%, a difference of 0.20%), and French Canadian (57.8%, a difference of 0.20%).
| Demographics | Rating | Rank | College, 1 year or more |
| Ghanaians | 20.9 /100 | #203 | Fair 58.4% |
| Panamanians | 19.2 /100 | #204 | Poor 58.3% |
| Immigrants | Zaire | 18.7 /100 | #205 | Poor 58.3% |
| Immigrants | Vietnam | 18.2 /100 | #206 | Poor 58.2% |
| Senegalese | 16.9 /100 | #207 | Poor 58.2% |
| Immigrants | Uruguay | 15.2 /100 | #208 | Poor 58.1% |
| Immigrants | Middle Africa | 14.0 /100 | #209 | Poor 58.0% |
| Tsimshian | 13.5 /100 | #210 | Poor 57.9% |
| Immigrants | Nigeria | 13.3 /100 | #211 | Poor 57.9% |
| Immigrants | Senegal | 11.8 /100 | #212 | Poor 57.8% |
| French Canadians | 11.8 /100 | #213 | Poor 57.8% |
| Immigrants | Colombia | 11.6 /100 | #214 | Poor 57.8% |
| Tongans | 11.6 /100 | #215 | Poor 57.8% |
| Immigrants | Peru | 10.6 /100 | #216 | Poor 57.7% |
| Immigrants | Panama | 9.1 /100 | #217 | Tragic 57.6% |