British West Indian vs Marshallese College, 1 year or more
COMPARE
British West Indian
Marshallese
College, 1 year or more
College, 1 year or more Comparison
British West Indians
Marshallese
54.5%
COLLEGE, 1 YEAR OR MORE
0.2/ 100
METRIC RATING
268th/ 347
METRIC RANK
55.8%
COLLEGE, 1 YEAR OR MORE
1.0/ 100
METRIC RATING
242nd/ 347
METRIC RANK
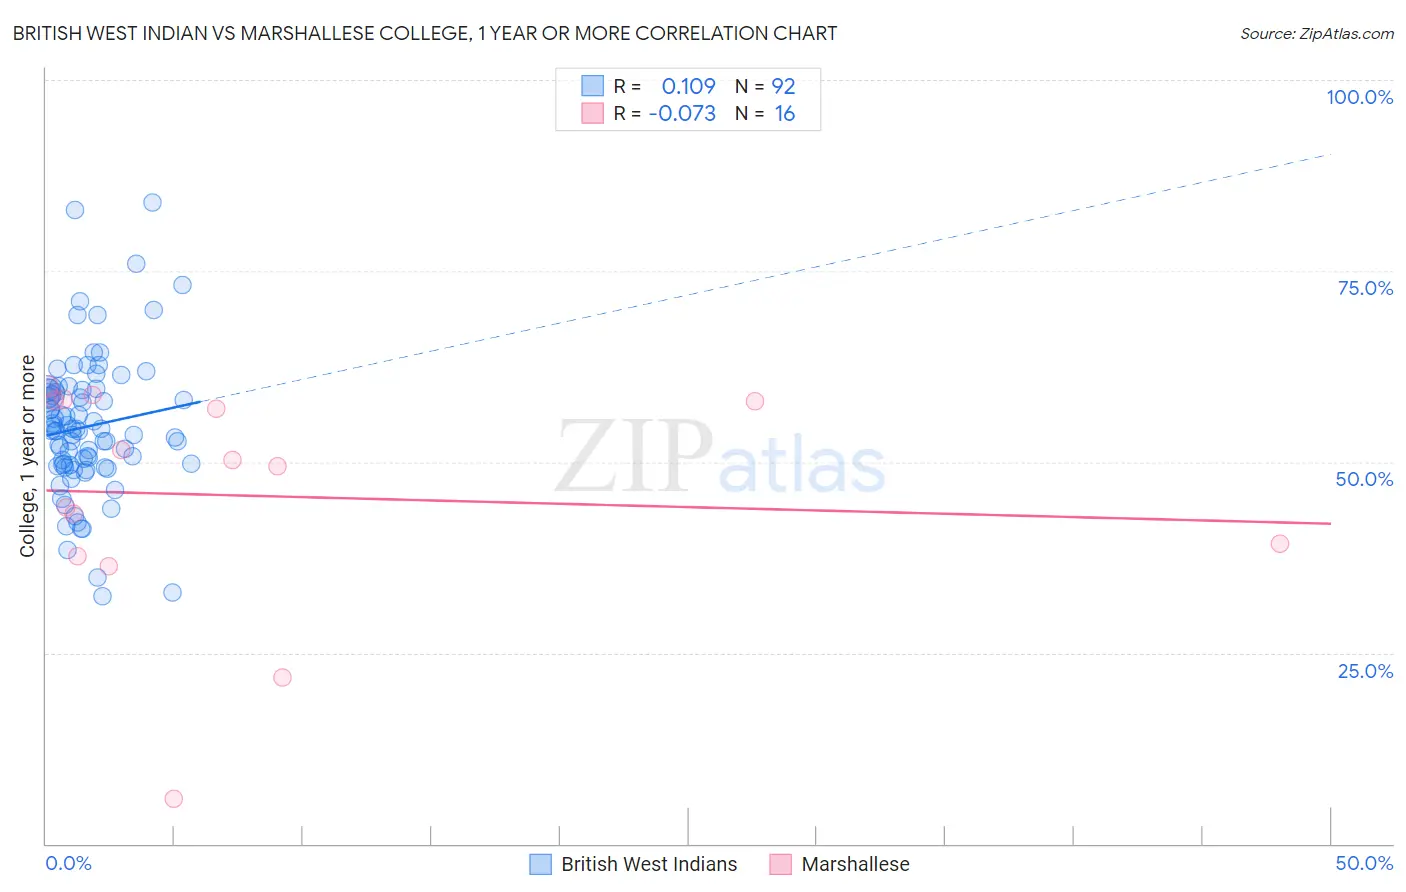
British West Indian vs Marshallese College, 1 year or more Correlation Chart
The statistical analysis conducted on geographies consisting of 152,694,627 people shows a poor positive correlation between the proportion of British West Indians and percentage of population with at least college, 1 year or more education in the United States with a correlation coefficient (R) of 0.109 and weighted average of 54.5%. Similarly, the statistical analysis conducted on geographies consisting of 14,761,315 people shows a slight negative correlation between the proportion of Marshallese and percentage of population with at least college, 1 year or more education in the United States with a correlation coefficient (R) of -0.073 and weighted average of 55.8%, a difference of 2.3%.
College, 1 year or more Correlation Summary
| Measurement | British West Indian | Marshallese |
| Minimum | 32.4% | 5.9% |
| Maximum | 84.0% | 60.0% |
| Range | 51.6% | 54.1% |
| Mean | 54.6% | 45.6% |
| Median | 54.1% | 49.9% |
| Interquartile 25% (IQ1) | 49.6% | 38.5% |
| Interquartile 75% (IQ3) | 59.2% | 58.0% |
| Interquartile Range (IQR) | 9.6% | 19.5% |
| Standard Deviation (Sample) | 9.2% | 15.0% |
| Standard Deviation (Population) | 9.1% | 14.6% |
Similar Demographics by College, 1 year or more
Demographics Similar to British West Indians by College, 1 year or more
In terms of college, 1 year or more, the demographic groups most similar to British West Indians are Bangladeshi (54.5%, a difference of 0.030%), Crow (54.5%, a difference of 0.070%), Bahamian (54.5%, a difference of 0.090%), Comanche (54.4%, a difference of 0.14%), and Blackfeet (54.6%, a difference of 0.16%).
| Demographics | Rating | Rank | College, 1 year or more |
| Ottawa | 0.3 /100 | #261 | Tragic 54.9% |
| Immigrants | St. Vincent and the Grenadines | 0.3 /100 | #262 | Tragic 54.8% |
| U.S. Virgin Islanders | 0.3 /100 | #263 | Tragic 54.8% |
| Immigrants | Micronesia | 0.3 /100 | #264 | Tragic 54.8% |
| Immigrants | Laos | 0.2 /100 | #265 | Tragic 54.7% |
| Potawatomi | 0.2 /100 | #266 | Tragic 54.6% |
| Blackfeet | 0.2 /100 | #267 | Tragic 54.6% |
| British West Indians | 0.2 /100 | #268 | Tragic 54.5% |
| Bangladeshis | 0.2 /100 | #269 | Tragic 54.5% |
| Crow | 0.2 /100 | #270 | Tragic 54.5% |
| Bahamians | 0.2 /100 | #271 | Tragic 54.5% |
| Comanche | 0.2 /100 | #272 | Tragic 54.4% |
| Immigrants | Grenada | 0.2 /100 | #273 | Tragic 54.4% |
| Belizeans | 0.2 /100 | #274 | Tragic 54.4% |
| Americans | 0.2 /100 | #275 | Tragic 54.4% |
Demographics Similar to Marshallese by College, 1 year or more
In terms of college, 1 year or more, the demographic groups most similar to Marshallese are Osage (55.8%, a difference of 0.010%), French American Indian (55.8%, a difference of 0.11%), Chippewa (55.7%, a difference of 0.13%), Trinidadian and Tobagonian (55.8%, a difference of 0.15%), and Immigrants from Liberia (55.7%, a difference of 0.20%).
| Demographics | Rating | Rank | College, 1 year or more |
| West Indians | 1.8 /100 | #235 | Tragic 56.3% |
| Iroquois | 1.7 /100 | #236 | Tragic 56.2% |
| Samoans | 1.6 /100 | #237 | Tragic 56.2% |
| Barbadians | 1.3 /100 | #238 | Tragic 56.0% |
| Puget Sound Salish | 1.1 /100 | #239 | Tragic 55.9% |
| Trinidadians and Tobagonians | 1.1 /100 | #240 | Tragic 55.8% |
| French American Indians | 1.0 /100 | #241 | Tragic 55.8% |
| Marshallese | 1.0 /100 | #242 | Tragic 55.8% |
| Osage | 1.0 /100 | #243 | Tragic 55.8% |
| Chippewa | 0.9 /100 | #244 | Tragic 55.7% |
| Immigrants | Liberia | 0.8 /100 | #245 | Tragic 55.7% |
| Malaysians | 0.8 /100 | #246 | Tragic 55.6% |
| Hawaiians | 0.8 /100 | #247 | Tragic 55.6% |
| Immigrants | Congo | 0.8 /100 | #248 | Tragic 55.6% |
| Immigrants | Trinidad and Tobago | 0.7 /100 | #249 | Tragic 55.5% |