British West Indian vs Mexican Births to Unmarried Women
COMPARE
British West Indian
Mexican
Births to Unmarried Women
Births to Unmarried Women Comparison
British West Indians
Mexicans
38.0%
BIRTHS TO UNMARRIED WOMEN
0.0/ 100
METRIC RATING
294th/ 347
METRIC RANK
36.9%
BIRTHS TO UNMARRIED WOMEN
0.1/ 100
METRIC RATING
273rd/ 347
METRIC RANK
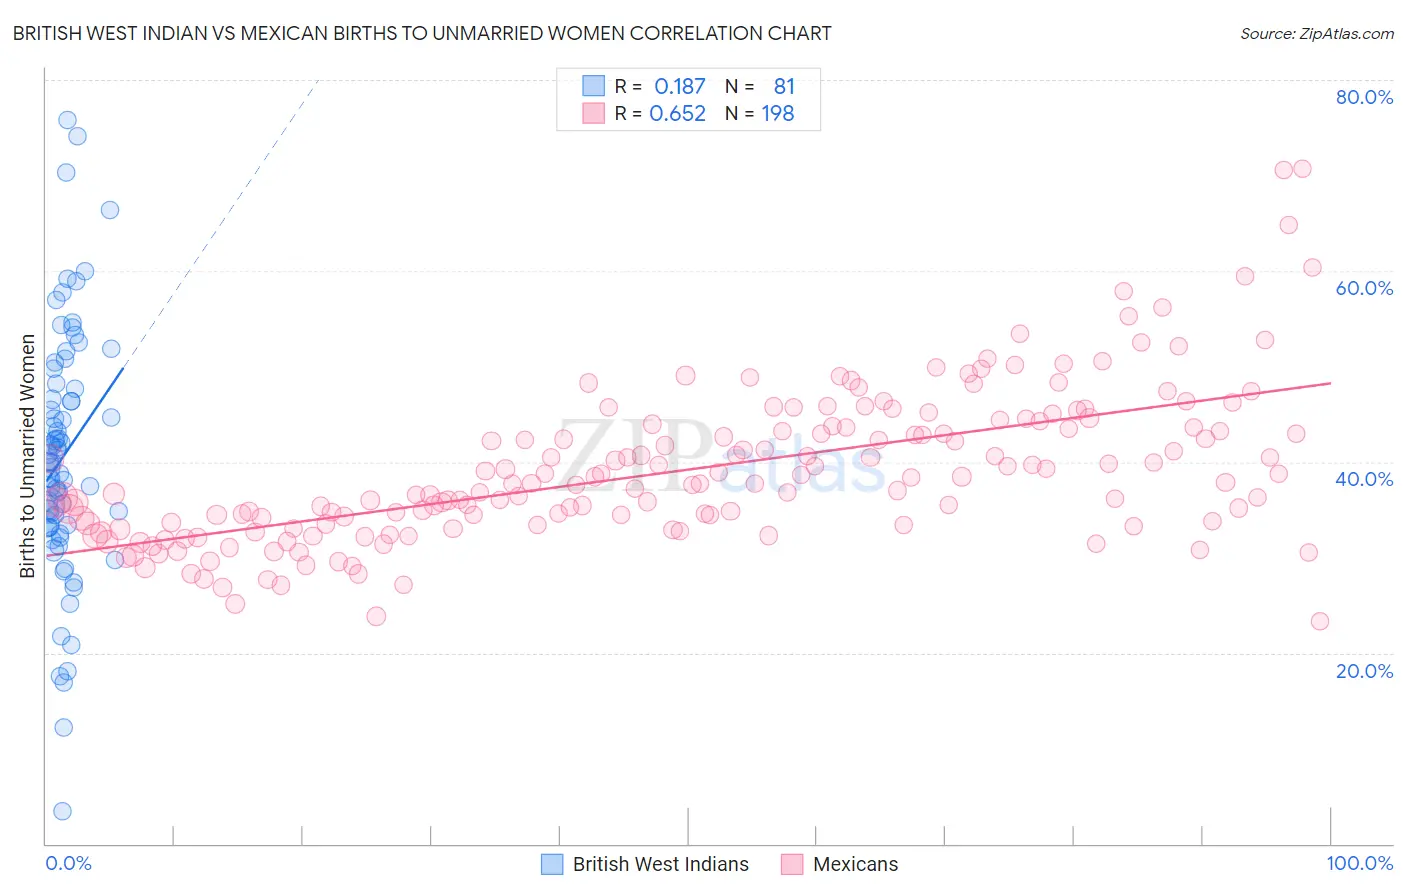
British West Indian vs Mexican Births to Unmarried Women Correlation Chart
The statistical analysis conducted on geographies consisting of 148,832,690 people shows a poor positive correlation between the proportion of British West Indians and percentage of births to unmarried women in the United States with a correlation coefficient (R) of 0.187 and weighted average of 38.0%. Similarly, the statistical analysis conducted on geographies consisting of 505,082,784 people shows a significant positive correlation between the proportion of Mexicans and percentage of births to unmarried women in the United States with a correlation coefficient (R) of 0.652 and weighted average of 36.9%, a difference of 2.9%.
Births to Unmarried Women Correlation Summary
| Measurement | British West Indian | Mexican |
| Minimum | 3.4% | 23.3% |
| Maximum | 75.8% | 70.7% |
| Range | 72.4% | 47.4% |
| Mean | 40.6% | 39.1% |
| Median | 39.9% | 37.7% |
| Interquartile 25% (IQ1) | 33.2% | 33.5% |
| Interquartile 75% (IQ3) | 48.0% | 43.6% |
| Interquartile Range (IQR) | 14.7% | 10.1% |
| Standard Deviation (Sample) | 13.1% | 8.0% |
| Standard Deviation (Population) | 13.0% | 7.9% |
Similar Demographics by Births to Unmarried Women
Demographics Similar to British West Indians by Births to Unmarried Women
In terms of births to unmarried women, the demographic groups most similar to British West Indians are Immigrants from Nicaragua (38.0%, a difference of 0.050%), Blackfeet (37.9%, a difference of 0.20%), Seminole (37.9%, a difference of 0.25%), Iroquois (38.2%, a difference of 0.55%), and Hispanic or Latino (37.8%, a difference of 0.59%).
| Demographics | Rating | Rank | Births to Unmarried Women |
| Creek | 0.0 /100 | #287 | Tragic 37.6% |
| Immigrants | Liberia | 0.0 /100 | #288 | Tragic 37.6% |
| Alaskan Athabascans | 0.0 /100 | #289 | Tragic 37.7% |
| Hispanics or Latinos | 0.0 /100 | #290 | Tragic 37.8% |
| Seminole | 0.0 /100 | #291 | Tragic 37.9% |
| Blackfeet | 0.0 /100 | #292 | Tragic 37.9% |
| Immigrants | Nicaragua | 0.0 /100 | #293 | Tragic 38.0% |
| British West Indians | 0.0 /100 | #294 | Tragic 38.0% |
| Iroquois | 0.0 /100 | #295 | Tragic 38.2% |
| Alaska Natives | 0.0 /100 | #296 | Tragic 38.3% |
| Dutch West Indians | 0.0 /100 | #297 | Tragic 38.4% |
| Jamaicans | 0.0 /100 | #298 | Tragic 38.5% |
| Spanish Americans | 0.0 /100 | #299 | Tragic 38.6% |
| Immigrants | West Indies | 0.0 /100 | #300 | Tragic 38.6% |
| Haitians | 0.0 /100 | #301 | Tragic 38.6% |
Demographics Similar to Mexicans by Births to Unmarried Women
In terms of births to unmarried women, the demographic groups most similar to Mexicans are Cree (37.0%, a difference of 0.090%), Choctaw (36.9%, a difference of 0.12%), Barbadian (37.0%, a difference of 0.12%), Belizean (37.0%, a difference of 0.31%), and Immigrants from Barbados (36.8%, a difference of 0.33%).
| Demographics | Rating | Rank | Births to Unmarried Women |
| Immigrants | Senegal | 0.1 /100 | #266 | Tragic 36.7% |
| Central Americans | 0.1 /100 | #267 | Tragic 36.7% |
| Comanche | 0.1 /100 | #268 | Tragic 36.7% |
| Senegalese | 0.1 /100 | #269 | Tragic 36.8% |
| Immigrants | Congo | 0.1 /100 | #270 | Tragic 36.8% |
| Immigrants | Barbados | 0.1 /100 | #271 | Tragic 36.8% |
| Choctaw | 0.1 /100 | #272 | Tragic 36.9% |
| Mexicans | 0.1 /100 | #273 | Tragic 36.9% |
| Cree | 0.1 /100 | #274 | Tragic 37.0% |
| Barbadians | 0.1 /100 | #275 | Tragic 37.0% |
| Belizeans | 0.1 /100 | #276 | Tragic 37.0% |
| Guatemalans | 0.1 /100 | #277 | Tragic 37.1% |
| Immigrants | Latin America | 0.1 /100 | #278 | Tragic 37.1% |
| West Indians | 0.1 /100 | #279 | Tragic 37.3% |
| Immigrants | St. Vincent and the Grenadines | 0.1 /100 | #280 | Tragic 37.3% |