Palestinian vs Immigrants from Nicaragua College, 1 year or more
COMPARE
Palestinian
Immigrants from Nicaragua
College, 1 year or more
College, 1 year or more Comparison
Palestinians
Immigrants from Nicaragua
62.0%
COLLEGE, 1 YEAR OR MORE
96.3/ 100
METRIC RATING
106th/ 347
METRIC RANK
52.4%
COLLEGE, 1 YEAR OR MORE
0.0/ 100
METRIC RATING
299th/ 347
METRIC RANK
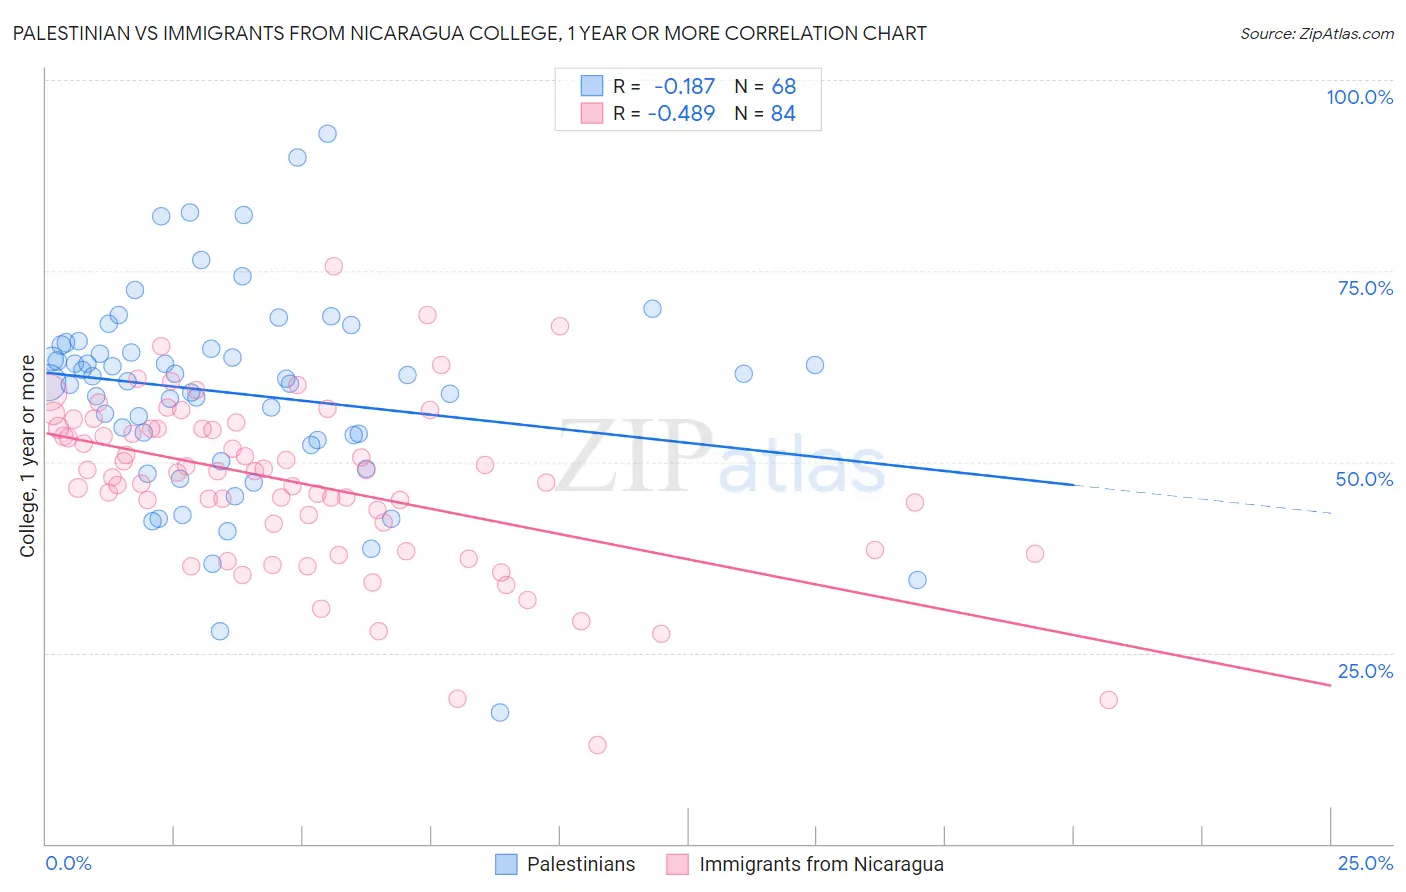
Palestinian vs Immigrants from Nicaragua College, 1 year or more Correlation Chart
The statistical analysis conducted on geographies consisting of 216,461,838 people shows a poor negative correlation between the proportion of Palestinians and percentage of population with at least college, 1 year or more education in the United States with a correlation coefficient (R) of -0.187 and weighted average of 62.0%. Similarly, the statistical analysis conducted on geographies consisting of 236,341,850 people shows a moderate negative correlation between the proportion of Immigrants from Nicaragua and percentage of population with at least college, 1 year or more education in the United States with a correlation coefficient (R) of -0.489 and weighted average of 52.4%, a difference of 18.4%.
College, 1 year or more Correlation Summary
| Measurement | Palestinian | Immigrants from Nicaragua |
| Minimum | 17.1% | 13.0% |
| Maximum | 92.9% | 75.6% |
| Range | 75.8% | 62.6% |
| Mean | 58.9% | 47.2% |
| Median | 60.7% | 48.6% |
| Interquartile 25% (IQ1) | 52.5% | 40.2% |
| Interquartile 75% (IQ3) | 65.1% | 54.4% |
| Interquartile Range (IQR) | 12.6% | 14.2% |
| Standard Deviation (Sample) | 13.4% | 11.2% |
| Standard Deviation (Population) | 13.3% | 11.1% |
Similar Demographics by College, 1 year or more
Demographics Similar to Palestinians by College, 1 year or more
In terms of college, 1 year or more, the demographic groups most similar to Palestinians are Immigrants from Nepal (62.0%, a difference of 0.0%), Chilean (62.0%, a difference of 0.020%), Afghan (62.0%, a difference of 0.030%), Luxembourger (62.1%, a difference of 0.15%), and Icelander (62.1%, a difference of 0.17%).
| Demographics | Rating | Rank | College, 1 year or more |
| Croatians | 97.1 /100 | #99 | Exceptional 62.2% |
| Icelanders | 96.8 /100 | #100 | Exceptional 62.1% |
| Swedes | 96.8 /100 | #101 | Exceptional 62.1% |
| Luxembourgers | 96.7 /100 | #102 | Exceptional 62.1% |
| Afghans | 96.4 /100 | #103 | Exceptional 62.0% |
| Chileans | 96.4 /100 | #104 | Exceptional 62.0% |
| Immigrants | Nepal | 96.3 /100 | #105 | Exceptional 62.0% |
| Palestinians | 96.3 /100 | #106 | Exceptional 62.0% |
| Immigrants | Ukraine | 95.8 /100 | #107 | Exceptional 61.9% |
| Syrians | 95.7 /100 | #108 | Exceptional 61.9% |
| Immigrants | Northern Africa | 95.7 /100 | #109 | Exceptional 61.9% |
| Europeans | 95.6 /100 | #110 | Exceptional 61.8% |
| Macedonians | 95.6 /100 | #111 | Exceptional 61.8% |
| Austrians | 95.4 /100 | #112 | Exceptional 61.8% |
| Ukrainians | 95.2 /100 | #113 | Exceptional 61.8% |
Demographics Similar to Immigrants from Nicaragua by College, 1 year or more
In terms of college, 1 year or more, the demographic groups most similar to Immigrants from Nicaragua are Choctaw (52.3%, a difference of 0.040%), Haitian (52.3%, a difference of 0.10%), Puerto Rican (52.2%, a difference of 0.23%), Creek (52.2%, a difference of 0.30%), and Immigrants from Dominica (52.5%, a difference of 0.34%).
| Demographics | Rating | Rank | College, 1 year or more |
| Chickasaw | 0.0 /100 | #292 | Tragic 53.3% |
| Blacks/African Americans | 0.0 /100 | #293 | Tragic 53.3% |
| Cherokee | 0.0 /100 | #294 | Tragic 53.2% |
| Yaqui | 0.0 /100 | #295 | Tragic 53.2% |
| Sioux | 0.0 /100 | #296 | Tragic 53.0% |
| Paiute | 0.0 /100 | #297 | Tragic 52.9% |
| Immigrants | Dominica | 0.0 /100 | #298 | Tragic 52.5% |
| Immigrants | Nicaragua | 0.0 /100 | #299 | Tragic 52.4% |
| Choctaw | 0.0 /100 | #300 | Tragic 52.3% |
| Haitians | 0.0 /100 | #301 | Tragic 52.3% |
| Puerto Ricans | 0.0 /100 | #302 | Tragic 52.2% |
| Creek | 0.0 /100 | #303 | Tragic 52.2% |
| Central Americans | 0.0 /100 | #304 | Tragic 52.1% |
| Seminole | 0.0 /100 | #305 | Tragic 52.1% |
| Mexican American Indians | 0.0 /100 | #306 | Tragic 51.9% |