Cuban vs Immigrants from Nicaragua College, 1 year or more
COMPARE
Cuban
Immigrants from Nicaragua
College, 1 year or more
College, 1 year or more Comparison
Cubans
Immigrants from Nicaragua
53.4%
COLLEGE, 1 YEAR OR MORE
0.0/ 100
METRIC RATING
291st/ 347
METRIC RANK
52.4%
COLLEGE, 1 YEAR OR MORE
0.0/ 100
METRIC RATING
299th/ 347
METRIC RANK
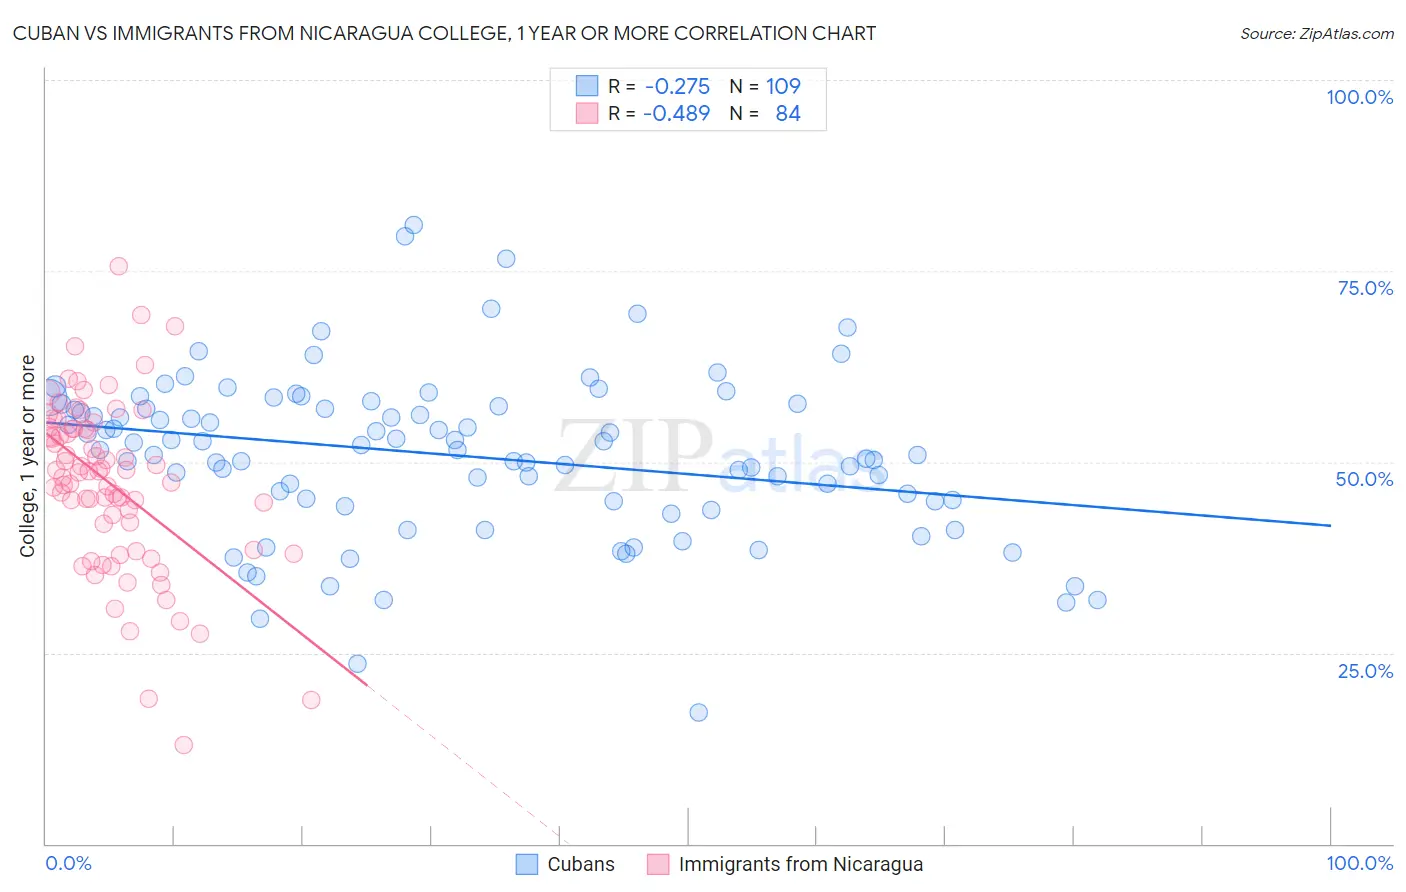
Cuban vs Immigrants from Nicaragua College, 1 year or more Correlation Chart
The statistical analysis conducted on geographies consisting of 449,372,622 people shows a weak negative correlation between the proportion of Cubans and percentage of population with at least college, 1 year or more education in the United States with a correlation coefficient (R) of -0.275 and weighted average of 53.4%. Similarly, the statistical analysis conducted on geographies consisting of 236,341,850 people shows a moderate negative correlation between the proportion of Immigrants from Nicaragua and percentage of population with at least college, 1 year or more education in the United States with a correlation coefficient (R) of -0.489 and weighted average of 52.4%, a difference of 1.9%.
College, 1 year or more Correlation Summary
| Measurement | Cuban | Immigrants from Nicaragua |
| Minimum | 17.3% | 13.0% |
| Maximum | 81.0% | 75.6% |
| Range | 63.7% | 62.6% |
| Mean | 50.8% | 47.2% |
| Median | 51.5% | 48.6% |
| Interquartile 25% (IQ1) | 44.8% | 40.2% |
| Interquartile 75% (IQ3) | 57.4% | 54.4% |
| Interquartile Range (IQR) | 12.6% | 14.2% |
| Standard Deviation (Sample) | 10.8% | 11.2% |
| Standard Deviation (Population) | 10.8% | 11.1% |
Demographics Similar to Cubans and Immigrants from Nicaragua by College, 1 year or more
In terms of college, 1 year or more, the demographic groups most similar to Cubans are Alaskan Athabascan (53.4%, a difference of 0.050%), Alaska Native (53.4%, a difference of 0.070%), Immigrants from Ecuador (53.4%, a difference of 0.070%), Chickasaw (53.3%, a difference of 0.13%), and Black/African American (53.3%, a difference of 0.15%). Similarly, the demographic groups most similar to Immigrants from Nicaragua are Choctaw (52.3%, a difference of 0.040%), Haitian (52.3%, a difference of 0.10%), Puerto Rican (52.2%, a difference of 0.23%), Creek (52.2%, a difference of 0.30%), and Immigrants from Dominica (52.5%, a difference of 0.34%).
| Demographics | Rating | Rank | College, 1 year or more |
| Immigrants | Guyana | 0.1 /100 | #285 | Tragic 53.5% |
| Central American Indians | 0.1 /100 | #286 | Tragic 53.5% |
| Immigrants | Belize | 0.1 /100 | #287 | Tragic 53.5% |
| Alaska Natives | 0.0 /100 | #288 | Tragic 53.4% |
| Immigrants | Ecuador | 0.0 /100 | #289 | Tragic 53.4% |
| Alaskan Athabascans | 0.0 /100 | #290 | Tragic 53.4% |
| Cubans | 0.0 /100 | #291 | Tragic 53.4% |
| Chickasaw | 0.0 /100 | #292 | Tragic 53.3% |
| Blacks/African Americans | 0.0 /100 | #293 | Tragic 53.3% |
| Cherokee | 0.0 /100 | #294 | Tragic 53.2% |
| Yaqui | 0.0 /100 | #295 | Tragic 53.2% |
| Sioux | 0.0 /100 | #296 | Tragic 53.0% |
| Paiute | 0.0 /100 | #297 | Tragic 52.9% |
| Immigrants | Dominica | 0.0 /100 | #298 | Tragic 52.5% |
| Immigrants | Nicaragua | 0.0 /100 | #299 | Tragic 52.4% |
| Choctaw | 0.0 /100 | #300 | Tragic 52.3% |
| Haitians | 0.0 /100 | #301 | Tragic 52.3% |
| Puerto Ricans | 0.0 /100 | #302 | Tragic 52.2% |
| Creek | 0.0 /100 | #303 | Tragic 52.2% |
| Central Americans | 0.0 /100 | #304 | Tragic 52.1% |
| Seminole | 0.0 /100 | #305 | Tragic 52.1% |