British West Indian vs Cherokee GED/Equivalency
COMPARE
British West Indian
Cherokee
GED/Equivalency
GED/Equivalency Comparison
British West Indians
Cherokee
82.0%
GED/EQUIVALENCY
0.0/ 100
METRIC RATING
293rd/ 347
METRIC RANK
83.9%
GED/EQUIVALENCY
1.3/ 100
METRIC RATING
243rd/ 347
METRIC RANK
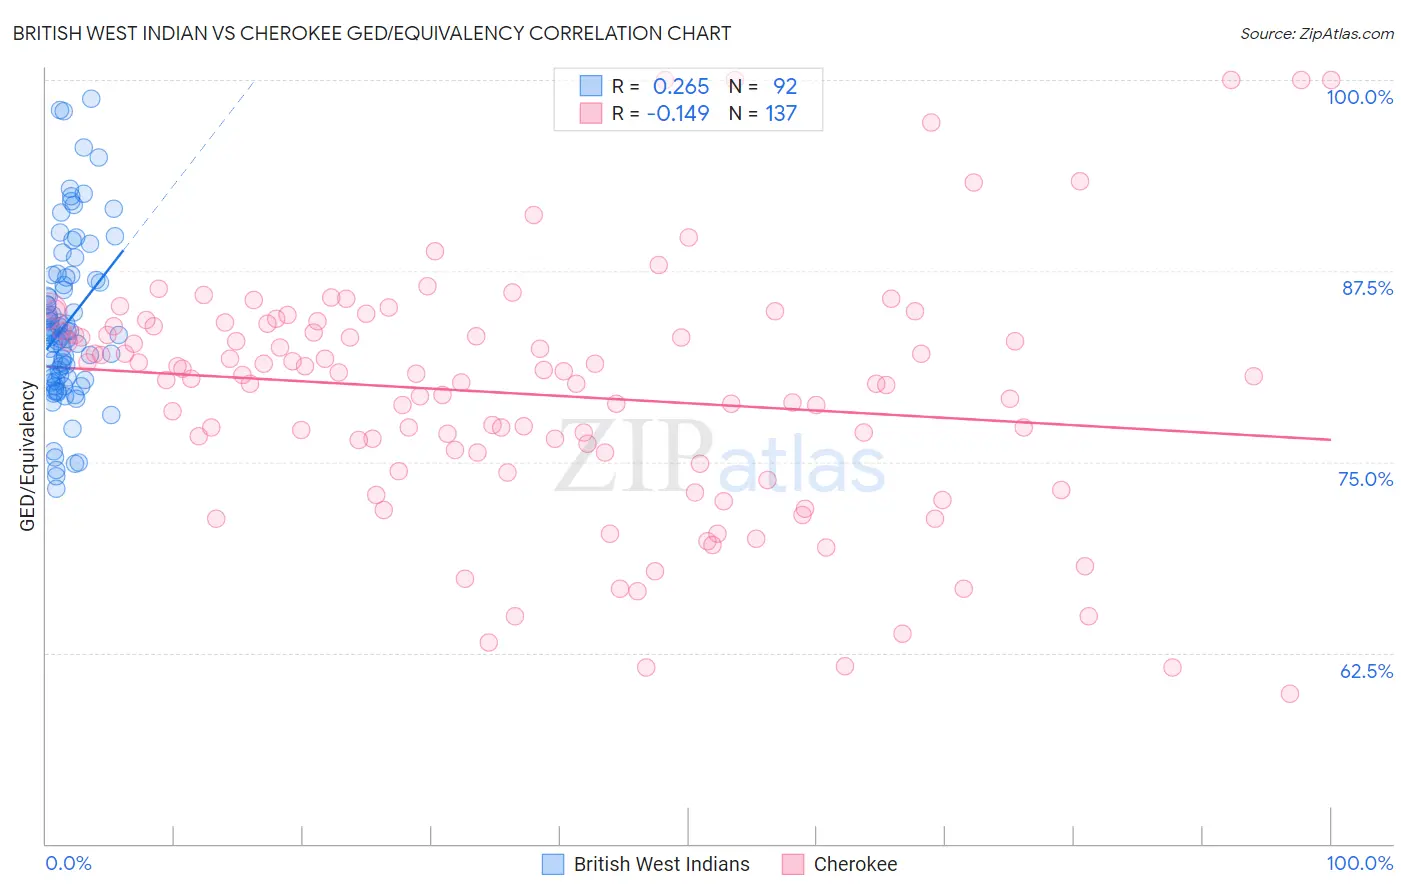
British West Indian vs Cherokee GED/Equivalency Correlation Chart
The statistical analysis conducted on geographies consisting of 152,614,591 people shows a weak positive correlation between the proportion of British West Indians and percentage of population with at least ged/equivalency education in the United States with a correlation coefficient (R) of 0.265 and weighted average of 82.0%. Similarly, the statistical analysis conducted on geographies consisting of 493,719,798 people shows a poor negative correlation between the proportion of Cherokee and percentage of population with at least ged/equivalency education in the United States with a correlation coefficient (R) of -0.149 and weighted average of 83.9%, a difference of 2.3%.
GED/Equivalency Correlation Summary
| Measurement | British West Indian | Cherokee |
| Minimum | 73.3% | 59.8% |
| Maximum | 98.8% | 100.0% |
| Range | 25.5% | 40.2% |
| Mean | 84.1% | 79.4% |
| Median | 83.3% | 80.6% |
| Interquartile 25% (IQ1) | 80.4% | 75.2% |
| Interquartile 75% (IQ3) | 87.0% | 83.9% |
| Interquartile Range (IQR) | 6.6% | 8.6% |
| Standard Deviation (Sample) | 5.4% | 8.0% |
| Standard Deviation (Population) | 5.4% | 8.0% |
Similar Demographics by GED/Equivalency
Demographics Similar to British West Indians by GED/Equivalency
In terms of ged/equivalency, the demographic groups most similar to British West Indians are Paiute (82.0%, a difference of 0.010%), Immigrants from St. Vincent and the Grenadines (82.0%, a difference of 0.030%), Cuban (82.0%, a difference of 0.040%), Haitian (82.1%, a difference of 0.070%), and Nepalese (81.9%, a difference of 0.080%).
| Demographics | Rating | Rank | GED/Equivalency |
| Immigrants | West Indies | 0.0 /100 | #286 | Tragic 82.4% |
| Japanese | 0.0 /100 | #287 | Tragic 82.4% |
| Pueblo | 0.0 /100 | #288 | Tragic 82.3% |
| Immigrants | Cambodia | 0.0 /100 | #289 | Tragic 82.2% |
| Haitians | 0.0 /100 | #290 | Tragic 82.1% |
| Cubans | 0.0 /100 | #291 | Tragic 82.0% |
| Paiute | 0.0 /100 | #292 | Tragic 82.0% |
| British West Indians | 0.0 /100 | #293 | Tragic 82.0% |
| Immigrants | St. Vincent and the Grenadines | 0.0 /100 | #294 | Tragic 82.0% |
| Nepalese | 0.0 /100 | #295 | Tragic 81.9% |
| Vietnamese | 0.0 /100 | #296 | Tragic 81.9% |
| Immigrants | Bangladesh | 0.0 /100 | #297 | Tragic 81.9% |
| Ute | 0.0 /100 | #298 | Tragic 81.8% |
| Ecuadorians | 0.0 /100 | #299 | Tragic 81.7% |
| Fijians | 0.0 /100 | #300 | Tragic 81.6% |
Demographics Similar to Cherokee by GED/Equivalency
In terms of ged/equivalency, the demographic groups most similar to Cherokee are Immigrants from Ghana (83.9%, a difference of 0.010%), Immigrants from Senegal (83.8%, a difference of 0.040%), Chickasaw (83.8%, a difference of 0.060%), Immigrants from Western Africa (83.8%, a difference of 0.10%), and Blackfeet (83.8%, a difference of 0.11%).
| Demographics | Rating | Rank | GED/Equivalency |
| Immigrants | Eritrea | 3.5 /100 | #236 | Tragic 84.3% |
| Sub-Saharan Africans | 3.0 /100 | #237 | Tragic 84.2% |
| Immigrants | Peru | 2.7 /100 | #238 | Tragic 84.2% |
| Immigrants | Bahamas | 2.6 /100 | #239 | Tragic 84.2% |
| Immigrants | South Eastern Asia | 2.5 /100 | #240 | Tragic 84.1% |
| Senegalese | 1.9 /100 | #241 | Tragic 84.0% |
| Sri Lankans | 1.9 /100 | #242 | Tragic 84.0% |
| Cherokee | 1.3 /100 | #243 | Tragic 83.9% |
| Immigrants | Ghana | 1.3 /100 | #244 | Tragic 83.9% |
| Immigrants | Senegal | 1.2 /100 | #245 | Tragic 83.8% |
| Chickasaw | 1.2 /100 | #246 | Tragic 83.8% |
| Immigrants | Western Africa | 1.1 /100 | #247 | Tragic 83.8% |
| Blackfeet | 1.1 /100 | #248 | Tragic 83.8% |
| Crow | 1.1 /100 | #249 | Tragic 83.8% |
| Shoshone | 1.0 /100 | #250 | Tragic 83.7% |