British vs Palestinian Single Father Poverty
COMPARE
British
Palestinian
Single Father Poverty
Single Father Poverty Comparison
British
Palestinians
16.8%
SINGLE FATHER POVERTY
5.6/ 100
METRIC RATING
227th/ 347
METRIC RANK
15.9%
SINGLE FATHER POVERTY
91.3/ 100
METRIC RATING
123rd/ 347
METRIC RANK
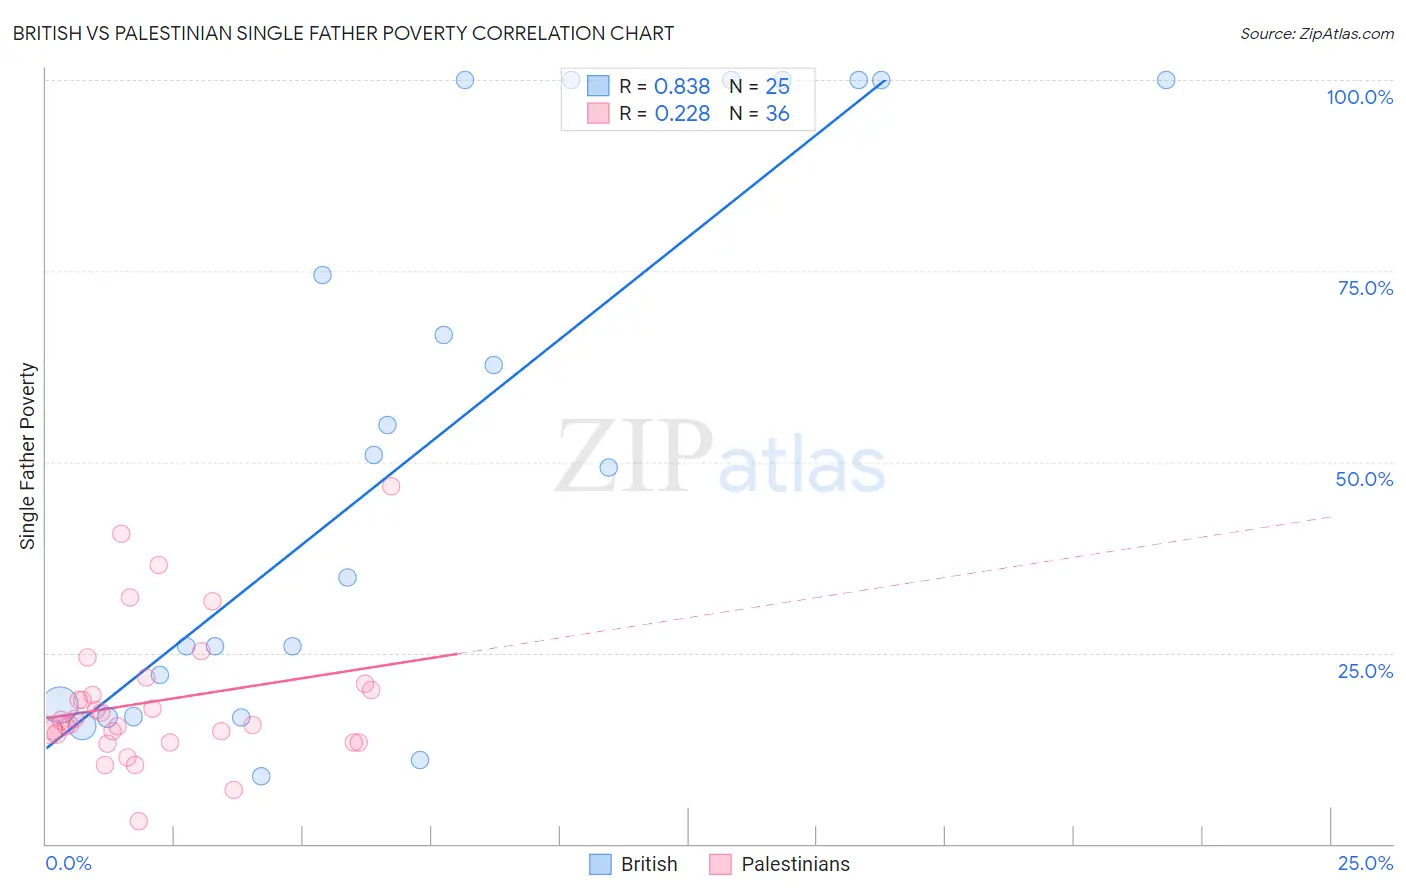
British vs Palestinian Single Father Poverty Correlation Chart
The statistical analysis conducted on geographies consisting of 389,691,429 people shows a very strong positive correlation between the proportion of British and poverty level among single fathers in the United States with a correlation coefficient (R) of 0.838 and weighted average of 16.8%. Similarly, the statistical analysis conducted on geographies consisting of 184,724,489 people shows a weak positive correlation between the proportion of Palestinians and poverty level among single fathers in the United States with a correlation coefficient (R) of 0.228 and weighted average of 15.9%, a difference of 5.9%.
Single Father Poverty Correlation Summary
| Measurement | British | Palestinian |
| Minimum | 8.8% | 3.0% |
| Maximum | 100.0% | 46.8% |
| Range | 91.2% | 43.8% |
| Mean | 51.9% | 18.7% |
| Median | 49.3% | 15.9% |
| Interquartile 25% (IQ1) | 17.4% | 13.8% |
| Interquartile 75% (IQ3) | 100.0% | 20.5% |
| Interquartile Range (IQR) | 82.6% | 6.7% |
| Standard Deviation (Sample) | 35.4% | 9.0% |
| Standard Deviation (Population) | 34.6% | 8.9% |
Similar Demographics by Single Father Poverty
Demographics Similar to British by Single Father Poverty
In terms of single father poverty, the demographic groups most similar to British are Belgian (16.8%, a difference of 0.070%), Hispanic or Latino (16.8%, a difference of 0.10%), Menominee (16.8%, a difference of 0.15%), Immigrants from Norway (16.8%, a difference of 0.16%), and Israeli (16.8%, a difference of 0.22%).
| Demographics | Rating | Rank | Single Father Poverty |
| Immigrants | Denmark | 8.1 /100 | #220 | Tragic 16.7% |
| Immigrants | Greece | 8.1 /100 | #221 | Tragic 16.7% |
| Immigrants | Spain | 8.0 /100 | #222 | Tragic 16.7% |
| Immigrants | Austria | 7.0 /100 | #223 | Tragic 16.8% |
| Immigrants | Norway | 6.5 /100 | #224 | Tragic 16.8% |
| Menominee | 6.4 /100 | #225 | Tragic 16.8% |
| Hispanics or Latinos | 6.1 /100 | #226 | Tragic 16.8% |
| British | 5.6 /100 | #227 | Tragic 16.8% |
| Belgians | 5.3 /100 | #228 | Tragic 16.8% |
| Israelis | 4.6 /100 | #229 | Tragic 16.8% |
| Immigrants | Trinidad and Tobago | 4.5 /100 | #230 | Tragic 16.8% |
| Spanish Americans | 3.7 /100 | #231 | Tragic 16.9% |
| Immigrants | Grenada | 3.7 /100 | #232 | Tragic 16.9% |
| Senegalese | 3.2 /100 | #233 | Tragic 16.9% |
| Marshallese | 3.1 /100 | #234 | Tragic 16.9% |
Demographics Similar to Palestinians by Single Father Poverty
In terms of single father poverty, the demographic groups most similar to Palestinians are Immigrants from Panama (15.9%, a difference of 0.010%), Iraqi (15.9%, a difference of 0.020%), Hmong (15.9%, a difference of 0.030%), Sudanese (15.9%, a difference of 0.040%), and Immigrants from Liberia (15.9%, a difference of 0.040%).
| Demographics | Rating | Rank | Single Father Poverty |
| Immigrants | Argentina | 92.8 /100 | #116 | Exceptional 15.8% |
| Immigrants | Colombia | 92.6 /100 | #117 | Exceptional 15.8% |
| Immigrants | Eastern Europe | 92.5 /100 | #118 | Exceptional 15.8% |
| Immigrants | Belarus | 92.4 /100 | #119 | Exceptional 15.8% |
| Uruguayans | 92.1 /100 | #120 | Exceptional 15.9% |
| Immigrants | Immigrants | 91.9 /100 | #121 | Exceptional 15.9% |
| Sudanese | 91.6 /100 | #122 | Exceptional 15.9% |
| Palestinians | 91.3 /100 | #123 | Exceptional 15.9% |
| Immigrants | Panama | 91.3 /100 | #124 | Exceptional 15.9% |
| Iraqis | 91.2 /100 | #125 | Exceptional 15.9% |
| Hmong | 91.1 /100 | #126 | Exceptional 15.9% |
| Immigrants | Liberia | 91.1 /100 | #127 | Exceptional 15.9% |
| Immigrants | Nigeria | 90.8 /100 | #128 | Exceptional 15.9% |
| Immigrants | West Indies | 90.8 /100 | #129 | Exceptional 15.9% |
| Norwegians | 90.2 /100 | #130 | Exceptional 15.9% |