British vs Yuman GED/Equivalency
COMPARE
British
Yuman
GED/Equivalency
GED/Equivalency Comparison
British
Yuman
87.8%
GED/EQUIVALENCY
99.1/ 100
METRIC RATING
67th/ 347
METRIC RANK
79.2%
GED/EQUIVALENCY
0.0/ 100
METRIC RATING
326th/ 347
METRIC RANK
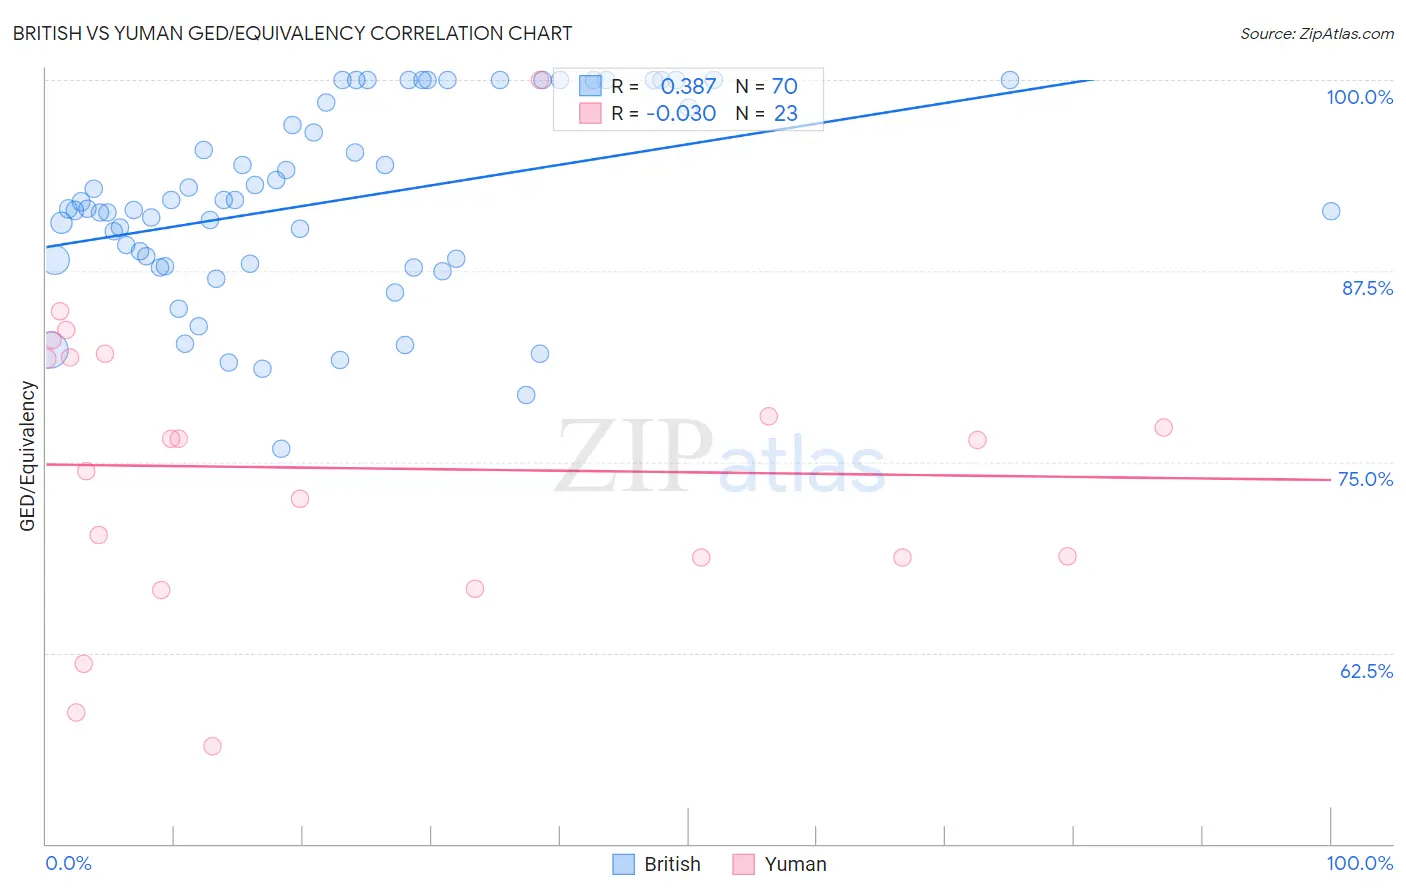
British vs Yuman GED/Equivalency Correlation Chart
The statistical analysis conducted on geographies consisting of 531,463,395 people shows a mild positive correlation between the proportion of British and percentage of population with at least ged/equivalency education in the United States with a correlation coefficient (R) of 0.387 and weighted average of 87.8%. Similarly, the statistical analysis conducted on geographies consisting of 40,696,349 people shows no correlation between the proportion of Yuman and percentage of population with at least ged/equivalency education in the United States with a correlation coefficient (R) of -0.030 and weighted average of 79.2%, a difference of 10.9%.
GED/Equivalency Correlation Summary
| Measurement | British | Yuman |
| Minimum | 75.9% | 56.4% |
| Maximum | 100.0% | 100.0% |
| Range | 24.1% | 43.6% |
| Mean | 92.0% | 74.6% |
| Median | 91.5% | 76.5% |
| Interquartile 25% (IQ1) | 88.0% | 68.8% |
| Interquartile 75% (IQ3) | 98.6% | 81.9% |
| Interquartile Range (IQR) | 10.6% | 13.1% |
| Standard Deviation (Sample) | 6.3% | 9.8% |
| Standard Deviation (Population) | 6.2% | 9.5% |
Similar Demographics by GED/Equivalency
Demographics Similar to British by GED/Equivalency
In terms of ged/equivalency, the demographic groups most similar to British are Immigrants from France (87.8%, a difference of 0.0%), Immigrants from North America (87.8%, a difference of 0.010%), Immigrants from Bulgaria (87.8%, a difference of 0.010%), Immigrants from Canada (87.9%, a difference of 0.050%), and Immigrants from Saudi Arabia (87.8%, a difference of 0.070%).
| Demographics | Rating | Rank | GED/Equivalency |
| Scandinavians | 99.3 /100 | #60 | Exceptional 87.9% |
| Europeans | 99.3 /100 | #61 | Exceptional 87.9% |
| Germans | 99.3 /100 | #62 | Exceptional 87.9% |
| Immigrants | Turkey | 99.2 /100 | #63 | Exceptional 87.9% |
| Immigrants | Canada | 99.2 /100 | #64 | Exceptional 87.9% |
| Immigrants | North America | 99.1 /100 | #65 | Exceptional 87.8% |
| Immigrants | Bulgaria | 99.1 /100 | #66 | Exceptional 87.8% |
| British | 99.1 /100 | #67 | Exceptional 87.8% |
| Immigrants | France | 99.1 /100 | #68 | Exceptional 87.8% |
| Immigrants | Saudi Arabia | 99.0 /100 | #69 | Exceptional 87.8% |
| Ukrainians | 98.8 /100 | #70 | Exceptional 87.7% |
| Austrians | 98.8 /100 | #71 | Exceptional 87.7% |
| Immigrants | Moldova | 98.8 /100 | #72 | Exceptional 87.7% |
| Belgians | 98.8 /100 | #73 | Exceptional 87.7% |
| Immigrants | Kuwait | 98.8 /100 | #74 | Exceptional 87.7% |
Demographics Similar to Yuman by GED/Equivalency
In terms of ged/equivalency, the demographic groups most similar to Yuman are Central American (79.2%, a difference of 0.020%), Honduran (79.3%, a difference of 0.090%), Hispanic or Latino (79.1%, a difference of 0.13%), Dominican (79.1%, a difference of 0.17%), and Mexican American Indian (79.4%, a difference of 0.21%).
| Demographics | Rating | Rank | GED/Equivalency |
| Immigrants | Belize | 0.0 /100 | #319 | Tragic 80.5% |
| Immigrants | Cuba | 0.0 /100 | #320 | Tragic 80.2% |
| Yup'ik | 0.0 /100 | #321 | Tragic 80.0% |
| Lumbee | 0.0 /100 | #322 | Tragic 80.0% |
| Immigrants | Nicaragua | 0.0 /100 | #323 | Tragic 79.9% |
| Mexican American Indians | 0.0 /100 | #324 | Tragic 79.4% |
| Hondurans | 0.0 /100 | #325 | Tragic 79.3% |
| Yuman | 0.0 /100 | #326 | Tragic 79.2% |
| Central Americans | 0.0 /100 | #327 | Tragic 79.2% |
| Hispanics or Latinos | 0.0 /100 | #328 | Tragic 79.1% |
| Dominicans | 0.0 /100 | #329 | Tragic 79.1% |
| Immigrants | Cabo Verde | 0.0 /100 | #330 | Tragic 78.9% |
| Immigrants | Honduras | 0.0 /100 | #331 | Tragic 78.7% |
| Immigrants | Azores | 0.0 /100 | #332 | Tragic 78.7% |
| Salvadorans | 0.0 /100 | #333 | Tragic 78.6% |