British vs British West Indian GED/Equivalency
COMPARE
British
British West Indian
GED/Equivalency
GED/Equivalency Comparison
British
British West Indians
87.8%
GED/EQUIVALENCY
99.1/ 100
METRIC RATING
67th/ 347
METRIC RANK
82.0%
GED/EQUIVALENCY
0.0/ 100
METRIC RATING
293rd/ 347
METRIC RANK
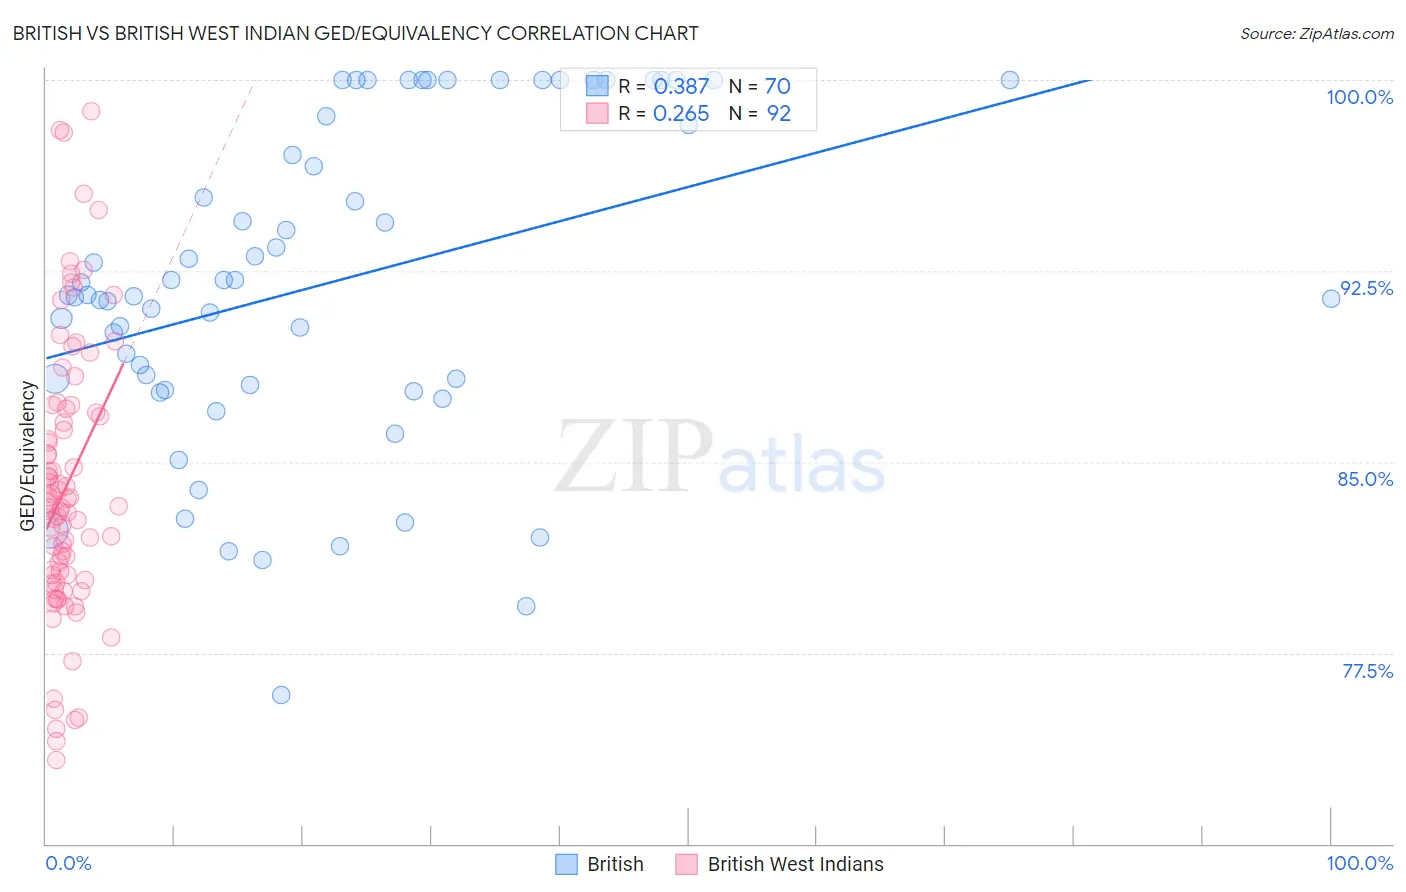
British vs British West Indian GED/Equivalency Correlation Chart
The statistical analysis conducted on geographies consisting of 531,463,395 people shows a mild positive correlation between the proportion of British and percentage of population with at least ged/equivalency education in the United States with a correlation coefficient (R) of 0.387 and weighted average of 87.8%. Similarly, the statistical analysis conducted on geographies consisting of 152,614,591 people shows a weak positive correlation between the proportion of British West Indians and percentage of population with at least ged/equivalency education in the United States with a correlation coefficient (R) of 0.265 and weighted average of 82.0%, a difference of 7.1%.
GED/Equivalency Correlation Summary
| Measurement | British | British West Indian |
| Minimum | 75.9% | 73.3% |
| Maximum | 100.0% | 98.8% |
| Range | 24.1% | 25.5% |
| Mean | 92.0% | 84.1% |
| Median | 91.5% | 83.3% |
| Interquartile 25% (IQ1) | 88.0% | 80.4% |
| Interquartile 75% (IQ3) | 98.6% | 87.0% |
| Interquartile Range (IQR) | 10.6% | 6.6% |
| Standard Deviation (Sample) | 6.3% | 5.4% |
| Standard Deviation (Population) | 6.2% | 5.4% |
Similar Demographics by GED/Equivalency
Demographics Similar to British by GED/Equivalency
In terms of ged/equivalency, the demographic groups most similar to British are Immigrants from France (87.8%, a difference of 0.0%), Immigrants from North America (87.8%, a difference of 0.010%), Immigrants from Bulgaria (87.8%, a difference of 0.010%), Immigrants from Canada (87.9%, a difference of 0.050%), and Immigrants from Saudi Arabia (87.8%, a difference of 0.070%).
| Demographics | Rating | Rank | GED/Equivalency |
| Scandinavians | 99.3 /100 | #60 | Exceptional 87.9% |
| Europeans | 99.3 /100 | #61 | Exceptional 87.9% |
| Germans | 99.3 /100 | #62 | Exceptional 87.9% |
| Immigrants | Turkey | 99.2 /100 | #63 | Exceptional 87.9% |
| Immigrants | Canada | 99.2 /100 | #64 | Exceptional 87.9% |
| Immigrants | North America | 99.1 /100 | #65 | Exceptional 87.8% |
| Immigrants | Bulgaria | 99.1 /100 | #66 | Exceptional 87.8% |
| British | 99.1 /100 | #67 | Exceptional 87.8% |
| Immigrants | France | 99.1 /100 | #68 | Exceptional 87.8% |
| Immigrants | Saudi Arabia | 99.0 /100 | #69 | Exceptional 87.8% |
| Ukrainians | 98.8 /100 | #70 | Exceptional 87.7% |
| Austrians | 98.8 /100 | #71 | Exceptional 87.7% |
| Immigrants | Moldova | 98.8 /100 | #72 | Exceptional 87.7% |
| Belgians | 98.8 /100 | #73 | Exceptional 87.7% |
| Immigrants | Kuwait | 98.8 /100 | #74 | Exceptional 87.7% |
Demographics Similar to British West Indians by GED/Equivalency
In terms of ged/equivalency, the demographic groups most similar to British West Indians are Paiute (82.0%, a difference of 0.010%), Immigrants from St. Vincent and the Grenadines (82.0%, a difference of 0.030%), Cuban (82.0%, a difference of 0.040%), Haitian (82.1%, a difference of 0.070%), and Nepalese (81.9%, a difference of 0.080%).
| Demographics | Rating | Rank | GED/Equivalency |
| Immigrants | West Indies | 0.0 /100 | #286 | Tragic 82.4% |
| Japanese | 0.0 /100 | #287 | Tragic 82.4% |
| Pueblo | 0.0 /100 | #288 | Tragic 82.3% |
| Immigrants | Cambodia | 0.0 /100 | #289 | Tragic 82.2% |
| Haitians | 0.0 /100 | #290 | Tragic 82.1% |
| Cubans | 0.0 /100 | #291 | Tragic 82.0% |
| Paiute | 0.0 /100 | #292 | Tragic 82.0% |
| British West Indians | 0.0 /100 | #293 | Tragic 82.0% |
| Immigrants | St. Vincent and the Grenadines | 0.0 /100 | #294 | Tragic 82.0% |
| Nepalese | 0.0 /100 | #295 | Tragic 81.9% |
| Vietnamese | 0.0 /100 | #296 | Tragic 81.9% |
| Immigrants | Bangladesh | 0.0 /100 | #297 | Tragic 81.9% |
| Ute | 0.0 /100 | #298 | Tragic 81.8% |
| Ecuadorians | 0.0 /100 | #299 | Tragic 81.7% |
| Fijians | 0.0 /100 | #300 | Tragic 81.6% |