Central American vs Bermudan College, Under 1 year
COMPARE
Central American
Bermudan
College, Under 1 year
College, Under 1 year Comparison
Central Americans
Bermudans
57.7%
COLLEGE, UNDER 1 YEAR
0.0/ 100
METRIC RATING
308th/ 347
METRIC RANK
65.2%
COLLEGE, UNDER 1 YEAR
42.0/ 100
METRIC RATING
184th/ 347
METRIC RANK
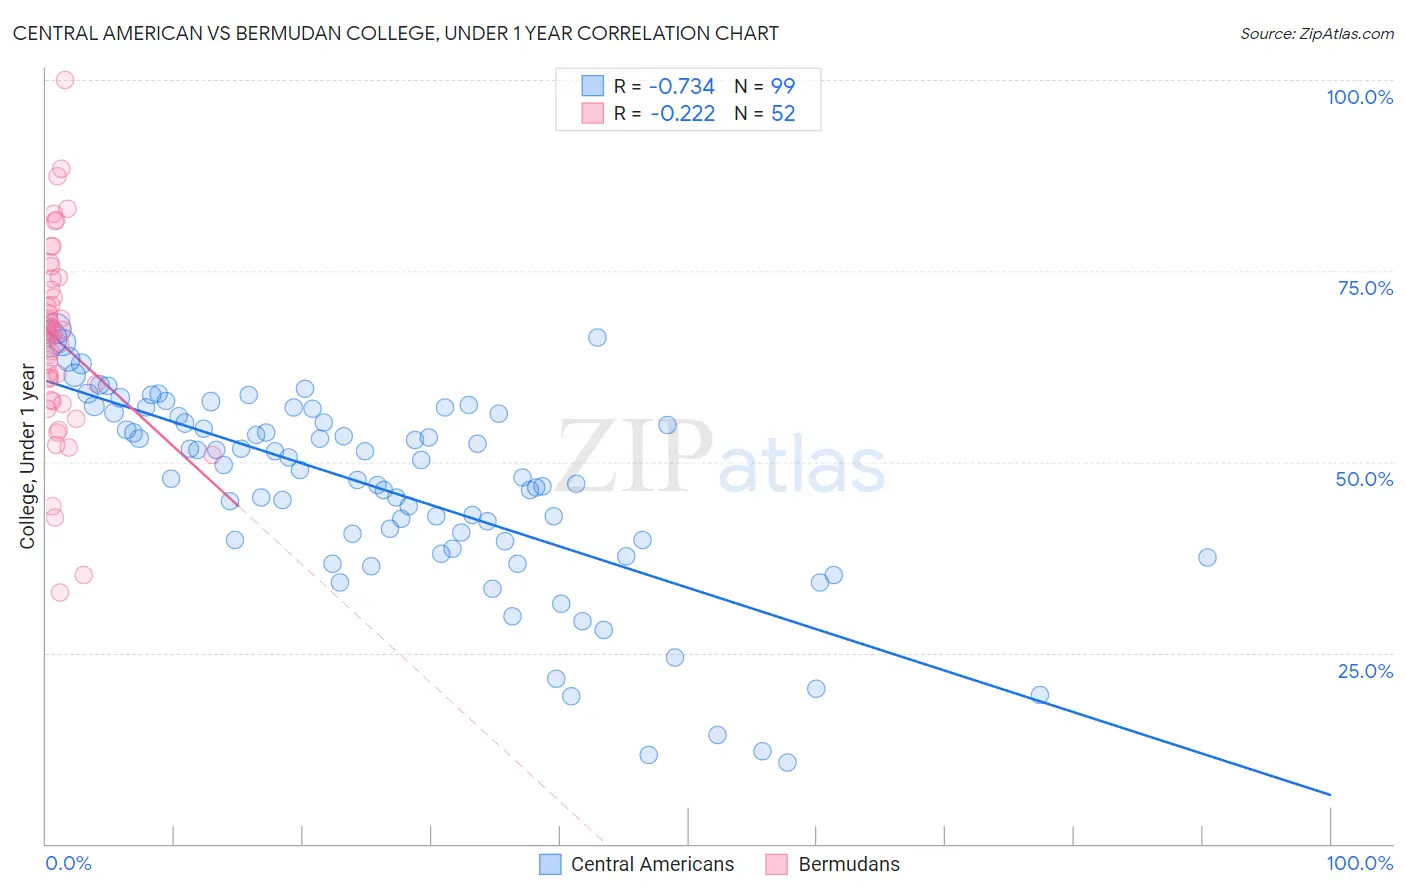
Central American vs Bermudan College, Under 1 year Correlation Chart
The statistical analysis conducted on geographies consisting of 504,615,987 people shows a strong negative correlation between the proportion of Central Americans and percentage of population with at least college, under 1 year education in the United States with a correlation coefficient (R) of -0.734 and weighted average of 57.7%. Similarly, the statistical analysis conducted on geographies consisting of 55,730,379 people shows a weak negative correlation between the proportion of Bermudans and percentage of population with at least college, under 1 year education in the United States with a correlation coefficient (R) of -0.222 and weighted average of 65.2%, a difference of 13.0%.
College, Under 1 year Correlation Summary
| Measurement | Central American | Bermudan |
| Minimum | 10.7% | 33.0% |
| Maximum | 67.5% | 100.0% |
| Range | 56.8% | 67.0% |
| Mean | 46.4% | 65.8% |
| Median | 48.9% | 66.8% |
| Interquartile 25% (IQ1) | 39.6% | 58.0% |
| Interquartile 75% (IQ3) | 56.3% | 73.2% |
| Interquartile Range (IQR) | 16.7% | 15.2% |
| Standard Deviation (Sample) | 13.0% | 12.9% |
| Standard Deviation (Population) | 12.9% | 12.7% |
Similar Demographics by College, Under 1 year
Demographics Similar to Central Americans by College, Under 1 year
In terms of college, under 1 year, the demographic groups most similar to Central Americans are Fijian (57.7%, a difference of 0.0%), Immigrants from Portugal (57.7%, a difference of 0.010%), Immigrants from Nicaragua (57.6%, a difference of 0.12%), Haitian (57.8%, a difference of 0.21%), and Kiowa (57.8%, a difference of 0.32%).
| Demographics | Rating | Rank | College, Under 1 year |
| Mexican American Indians | 0.0 /100 | #301 | Tragic 58.1% |
| Apache | 0.0 /100 | #302 | Tragic 58.0% |
| Immigrants | Dominica | 0.0 /100 | #303 | Tragic 57.9% |
| Kiowa | 0.0 /100 | #304 | Tragic 57.8% |
| Haitians | 0.0 /100 | #305 | Tragic 57.8% |
| Immigrants | Portugal | 0.0 /100 | #306 | Tragic 57.7% |
| Fijians | 0.0 /100 | #307 | Tragic 57.7% |
| Central Americans | 0.0 /100 | #308 | Tragic 57.7% |
| Immigrants | Nicaragua | 0.0 /100 | #309 | Tragic 57.6% |
| Pueblo | 0.0 /100 | #310 | Tragic 57.4% |
| Cajuns | 0.0 /100 | #311 | Tragic 57.3% |
| Salvadorans | 0.0 /100 | #312 | Tragic 57.3% |
| Dutch West Indians | 0.0 /100 | #313 | Tragic 57.2% |
| Hopi | 0.0 /100 | #314 | Tragic 57.1% |
| Hondurans | 0.0 /100 | #315 | Tragic 57.1% |
Demographics Similar to Bermudans by College, Under 1 year
In terms of college, under 1 year, the demographic groups most similar to Bermudans are Sri Lankan (65.2%, a difference of 0.010%), Immigrants from Poland (65.2%, a difference of 0.030%), Immigrants from Sierra Leone (65.1%, a difference of 0.10%), Immigrants from Africa (65.3%, a difference of 0.12%), and Spaniard (65.3%, a difference of 0.16%).
| Demographics | Rating | Rank | College, Under 1 year |
| Immigrants | North Macedonia | 48.6 /100 | #177 | Average 65.4% |
| German Russians | 48.3 /100 | #178 | Average 65.4% |
| Guamanians/Chamorros | 48.2 /100 | #179 | Average 65.4% |
| Dutch | 46.1 /100 | #180 | Average 65.3% |
| Spaniards | 45.5 /100 | #181 | Average 65.3% |
| Immigrants | Africa | 44.7 /100 | #182 | Average 65.3% |
| Immigrants | Poland | 42.6 /100 | #183 | Average 65.2% |
| Bermudans | 42.0 /100 | #184 | Average 65.2% |
| Sri Lankans | 41.7 /100 | #185 | Average 65.2% |
| Immigrants | Sierra Leone | 39.7 /100 | #186 | Fair 65.1% |
| Immigrants | Southern Europe | 34.3 /100 | #187 | Fair 64.9% |
| Immigrants | Albania | 32.0 /100 | #188 | Fair 64.9% |
| Spanish | 31.6 /100 | #189 | Fair 64.9% |
| Immigrants | Philippines | 30.1 /100 | #190 | Fair 64.8% |
| Immigrants | Armenia | 28.1 /100 | #191 | Fair 64.7% |