Immigrants from Bangladesh vs Bermudan College, Under 1 year
COMPARE
Immigrants from Bangladesh
Bermudan
College, Under 1 year
College, Under 1 year Comparison
Immigrants from Bangladesh
Bermudans
61.3%
COLLEGE, UNDER 1 YEAR
0.3/ 100
METRIC RATING
258th/ 347
METRIC RANK
65.2%
COLLEGE, UNDER 1 YEAR
42.0/ 100
METRIC RATING
184th/ 347
METRIC RANK
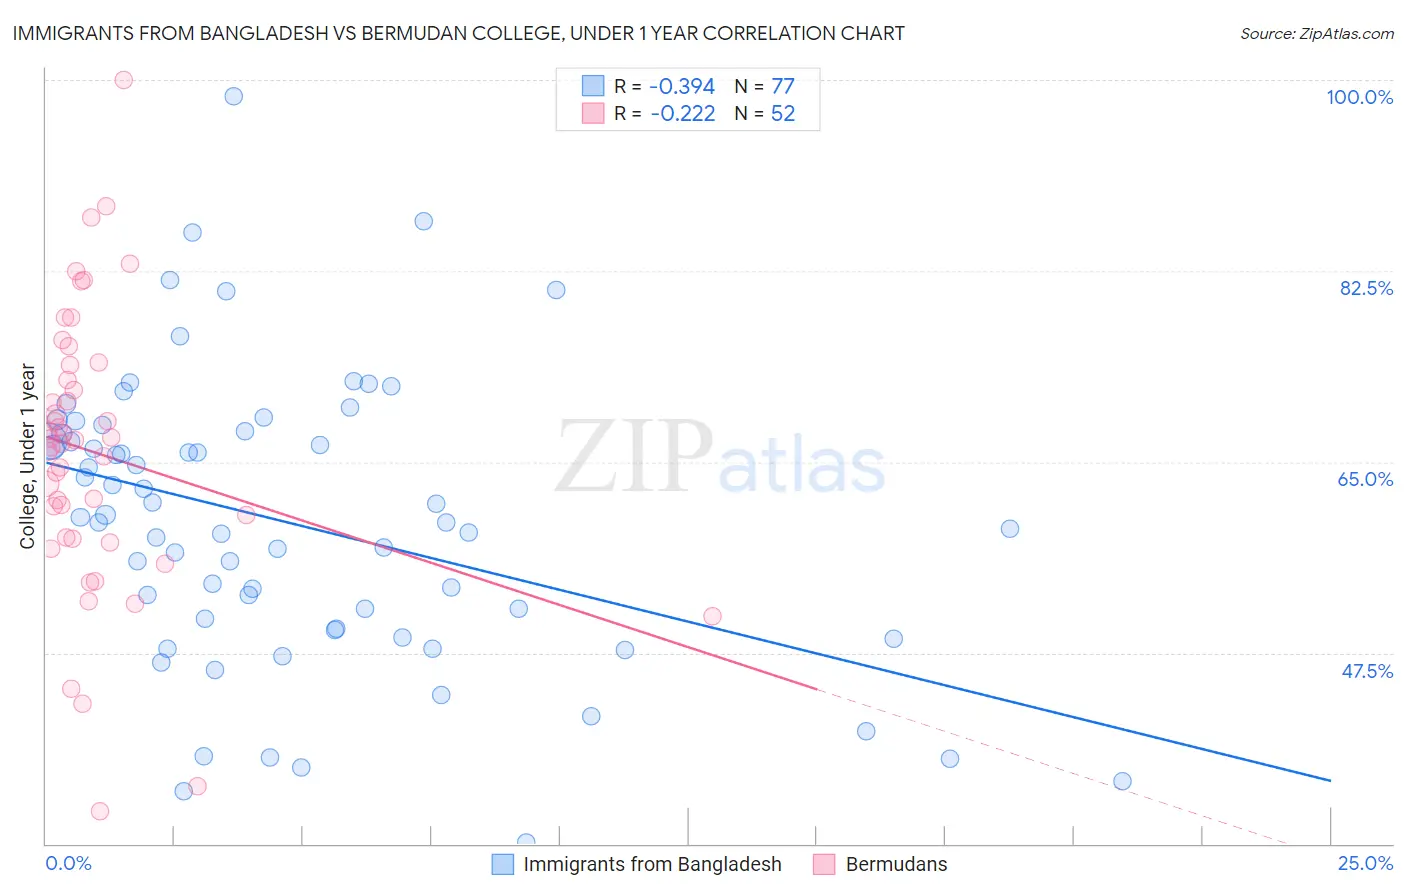
Immigrants from Bangladesh vs Bermudan College, Under 1 year Correlation Chart
The statistical analysis conducted on geographies consisting of 203,680,658 people shows a mild negative correlation between the proportion of Immigrants from Bangladesh and percentage of population with at least college, under 1 year education in the United States with a correlation coefficient (R) of -0.394 and weighted average of 61.3%. Similarly, the statistical analysis conducted on geographies consisting of 55,730,379 people shows a weak negative correlation between the proportion of Bermudans and percentage of population with at least college, under 1 year education in the United States with a correlation coefficient (R) of -0.222 and weighted average of 65.2%, a difference of 6.4%.
College, Under 1 year Correlation Summary
| Measurement | Immigrants from Bangladesh | Bermudan |
| Minimum | 30.1% | 33.0% |
| Maximum | 98.6% | 100.0% |
| Range | 68.5% | 67.0% |
| Mean | 59.4% | 65.8% |
| Median | 59.4% | 66.8% |
| Interquartile 25% (IQ1) | 49.6% | 58.0% |
| Interquartile 75% (IQ3) | 67.7% | 73.2% |
| Interquartile Range (IQR) | 18.1% | 15.2% |
| Standard Deviation (Sample) | 13.2% | 12.9% |
| Standard Deviation (Population) | 13.1% | 12.7% |
Similar Demographics by College, Under 1 year
Demographics Similar to Immigrants from Bangladesh by College, Under 1 year
In terms of college, under 1 year, the demographic groups most similar to Immigrants from Bangladesh are Indonesian (61.2%, a difference of 0.020%), Immigrants from Laos (61.3%, a difference of 0.060%), Bangladeshi (61.4%, a difference of 0.17%), Blackfeet (61.1%, a difference of 0.19%), and Comanche (61.4%, a difference of 0.22%).
| Demographics | Rating | Rank | College, Under 1 year |
| Immigrants | Micronesia | 0.5 /100 | #251 | Tragic 61.5% |
| West Indians | 0.4 /100 | #252 | Tragic 61.5% |
| Japanese | 0.4 /100 | #253 | Tragic 61.5% |
| Immigrants | Cambodia | 0.4 /100 | #254 | Tragic 61.5% |
| Comanche | 0.4 /100 | #255 | Tragic 61.4% |
| Bangladeshis | 0.4 /100 | #256 | Tragic 61.4% |
| Immigrants | Laos | 0.3 /100 | #257 | Tragic 61.3% |
| Immigrants | Bangladesh | 0.3 /100 | #258 | Tragic 61.3% |
| Indonesians | 0.3 /100 | #259 | Tragic 61.2% |
| Blackfeet | 0.3 /100 | #260 | Tragic 61.1% |
| Africans | 0.3 /100 | #261 | Tragic 61.1% |
| Barbadians | 0.2 /100 | #262 | Tragic 61.1% |
| Shoshone | 0.2 /100 | #263 | Tragic 61.1% |
| Trinidadians and Tobagonians | 0.2 /100 | #264 | Tragic 61.1% |
| Immigrants | Bahamas | 0.2 /100 | #265 | Tragic 61.1% |
Demographics Similar to Bermudans by College, Under 1 year
In terms of college, under 1 year, the demographic groups most similar to Bermudans are Sri Lankan (65.2%, a difference of 0.010%), Immigrants from Poland (65.2%, a difference of 0.030%), Immigrants from Sierra Leone (65.1%, a difference of 0.10%), Immigrants from Africa (65.3%, a difference of 0.12%), and Spaniard (65.3%, a difference of 0.16%).
| Demographics | Rating | Rank | College, Under 1 year |
| Immigrants | North Macedonia | 48.6 /100 | #177 | Average 65.4% |
| German Russians | 48.3 /100 | #178 | Average 65.4% |
| Guamanians/Chamorros | 48.2 /100 | #179 | Average 65.4% |
| Dutch | 46.1 /100 | #180 | Average 65.3% |
| Spaniards | 45.5 /100 | #181 | Average 65.3% |
| Immigrants | Africa | 44.7 /100 | #182 | Average 65.3% |
| Immigrants | Poland | 42.6 /100 | #183 | Average 65.2% |
| Bermudans | 42.0 /100 | #184 | Average 65.2% |
| Sri Lankans | 41.7 /100 | #185 | Average 65.2% |
| Immigrants | Sierra Leone | 39.7 /100 | #186 | Fair 65.1% |
| Immigrants | Southern Europe | 34.3 /100 | #187 | Fair 64.9% |
| Immigrants | Albania | 32.0 /100 | #188 | Fair 64.9% |
| Spanish | 31.6 /100 | #189 | Fair 64.9% |
| Immigrants | Philippines | 30.1 /100 | #190 | Fair 64.8% |
| Immigrants | Armenia | 28.1 /100 | #191 | Fair 64.7% |