Black/African American vs Apache In Labor Force | Age 30-34
COMPARE
Black/African American
Apache
In Labor Force | Age 30-34
In Labor Force | Age 30-34 Comparison
Blacks/African Americans
Apache
82.8%
IN LABOR FORCE | AGE 30-34
0.0/ 100
METRIC RATING
292nd/ 347
METRIC RANK
79.0%
IN LABOR FORCE | AGE 30-34
0.0/ 100
METRIC RATING
339th/ 347
METRIC RANK
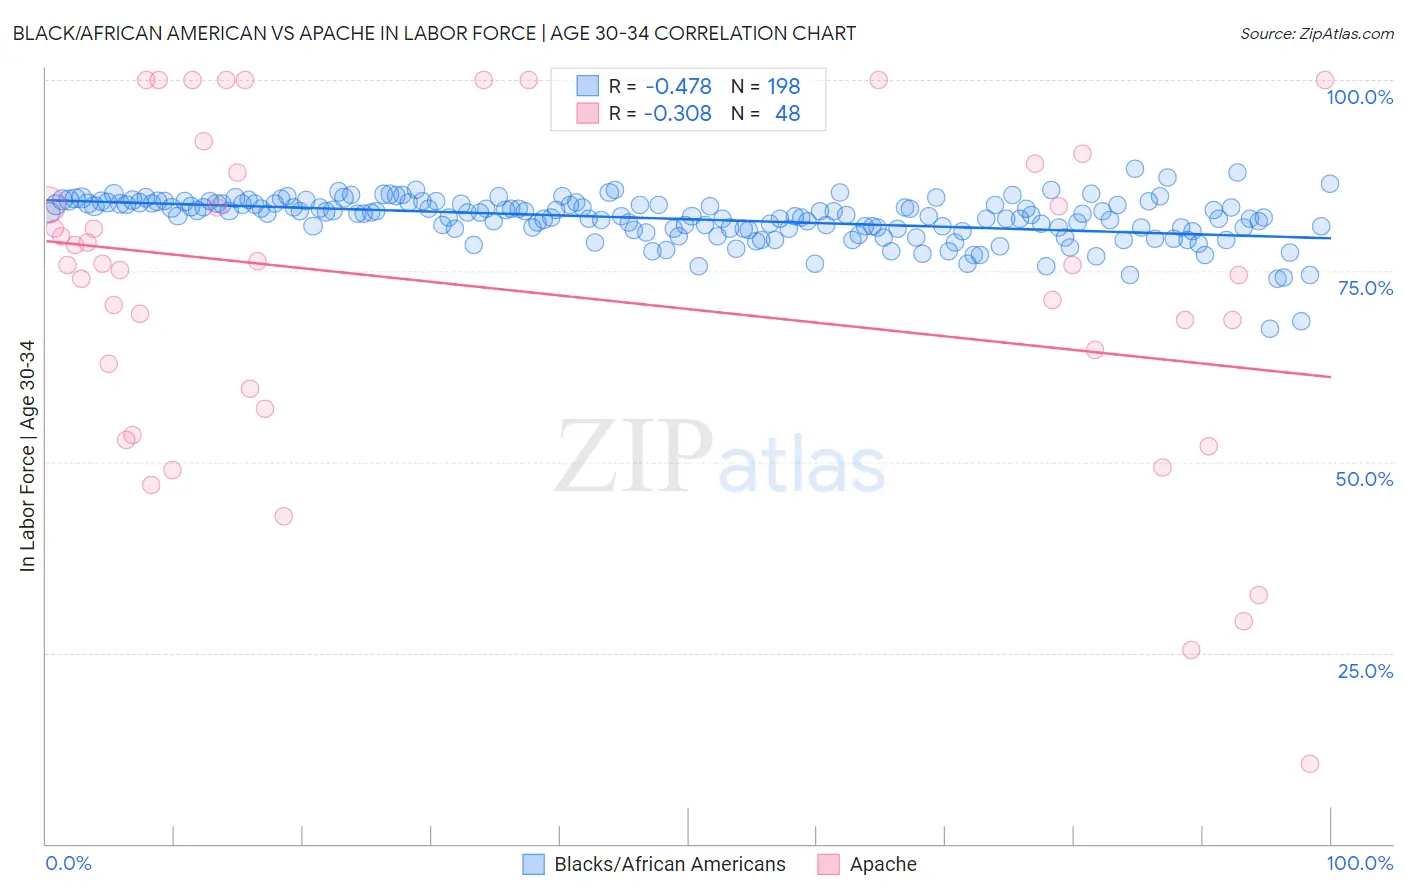
Black/African American vs Apache In Labor Force | Age 30-34 Correlation Chart
The statistical analysis conducted on geographies consisting of 564,859,333 people shows a moderate negative correlation between the proportion of Blacks/African Americans and labor force participation rate among population between the ages 30 and 34 in the United States with a correlation coefficient (R) of -0.478 and weighted average of 82.8%. Similarly, the statistical analysis conducted on geographies consisting of 231,033,691 people shows a mild negative correlation between the proportion of Apache and labor force participation rate among population between the ages 30 and 34 in the United States with a correlation coefficient (R) of -0.308 and weighted average of 79.0%, a difference of 4.8%.
In Labor Force | Age 30-34 Correlation Summary
| Measurement | Black/African American | Apache |
| Minimum | 67.4% | 10.5% |
| Maximum | 88.4% | 100.0% |
| Range | 21.0% | 89.5% |
| Mean | 81.8% | 72.3% |
| Median | 82.5% | 75.7% |
| Interquartile 25% (IQ1) | 80.5% | 58.3% |
| Interquartile 75% (IQ3) | 83.8% | 88.5% |
| Interquartile Range (IQR) | 3.3% | 30.2% |
| Standard Deviation (Sample) | 3.0% | 21.9% |
| Standard Deviation (Population) | 3.0% | 21.7% |
Similar Demographics by In Labor Force | Age 30-34
Demographics Similar to Blacks/African Americans by In Labor Force | Age 30-34
In terms of in labor force | age 30-34, the demographic groups most similar to Blacks/African Americans are Potawatomi (82.8%, a difference of 0.020%), Blackfeet (82.8%, a difference of 0.040%), Nepalese (82.7%, a difference of 0.060%), American (82.7%, a difference of 0.090%), and Pennsylvania German (82.6%, a difference of 0.21%).
| Demographics | Rating | Rank | In Labor Force | Age 30-34 |
| Cree | 0.0 /100 | #285 | Tragic 83.2% |
| Immigrants | Latin America | 0.0 /100 | #286 | Tragic 83.1% |
| Native Hawaiians | 0.0 /100 | #287 | Tragic 83.0% |
| Central American Indians | 0.0 /100 | #288 | Tragic 83.0% |
| Hawaiians | 0.0 /100 | #289 | Tragic 83.0% |
| Blackfeet | 0.0 /100 | #290 | Tragic 82.8% |
| Potawatomi | 0.0 /100 | #291 | Tragic 82.8% |
| Blacks/African Americans | 0.0 /100 | #292 | Tragic 82.8% |
| Nepalese | 0.0 /100 | #293 | Tragic 82.7% |
| Americans | 0.0 /100 | #294 | Tragic 82.7% |
| Pennsylvania Germans | 0.0 /100 | #295 | Tragic 82.6% |
| Chippewa | 0.0 /100 | #296 | Tragic 82.6% |
| Comanche | 0.0 /100 | #297 | Tragic 82.6% |
| Aleuts | 0.0 /100 | #298 | Tragic 82.6% |
| Immigrants | Central America | 0.0 /100 | #299 | Tragic 82.5% |
Demographics Similar to Apache by In Labor Force | Age 30-34
In terms of in labor force | age 30-34, the demographic groups most similar to Apache are Pima (79.0%, a difference of 0.030%), Ute (78.9%, a difference of 0.10%), Yakama (79.1%, a difference of 0.15%), Native/Alaskan (79.2%, a difference of 0.19%), and Marshallese (79.2%, a difference of 0.27%).
| Demographics | Rating | Rank | In Labor Force | Age 30-34 |
| Kiowa | 0.0 /100 | #332 | Tragic 79.8% |
| Inupiat | 0.0 /100 | #333 | Tragic 79.7% |
| Hopi | 0.0 /100 | #334 | Tragic 79.3% |
| Marshallese | 0.0 /100 | #335 | Tragic 79.2% |
| Natives/Alaskans | 0.0 /100 | #336 | Tragic 79.2% |
| Yakama | 0.0 /100 | #337 | Tragic 79.1% |
| Pima | 0.0 /100 | #338 | Tragic 79.0% |
| Apache | 0.0 /100 | #339 | Tragic 79.0% |
| Ute | 0.0 /100 | #340 | Tragic 78.9% |
| Immigrants | Yemen | 0.0 /100 | #341 | Tragic 78.2% |
| Tohono O'odham | 0.0 /100 | #342 | Tragic 77.7% |
| Lumbee | 0.0 /100 | #343 | Tragic 77.3% |
| Yuman | 0.0 /100 | #344 | Tragic 77.1% |
| Yup'ik | 0.0 /100 | #345 | Tragic 76.4% |
| Crow | 0.0 /100 | #346 | Tragic 75.9% |