Black/African American vs Apache 5th Grade
COMPARE
Black/African American
Apache
5th Grade
5th Grade Comparison
Blacks/African Americans
Apache
97.3%
5TH GRADE
31.8/ 100
METRIC RATING
190th/ 347
METRIC RANK
97.4%
5TH GRADE
57.2/ 100
METRIC RATING
166th/ 347
METRIC RANK
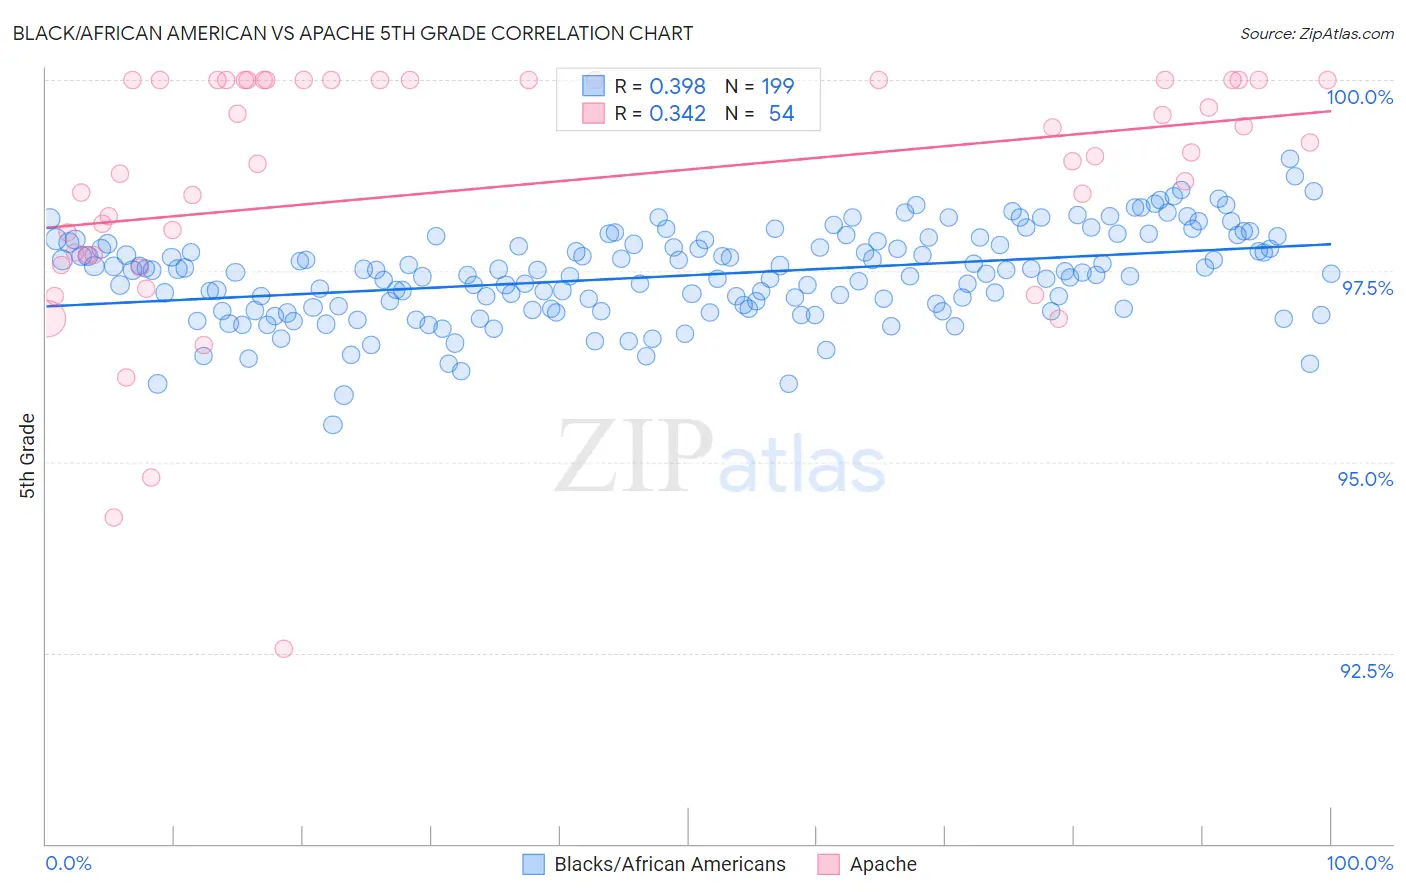
Black/African American vs Apache 5th Grade Correlation Chart
The statistical analysis conducted on geographies consisting of 566,043,750 people shows a mild positive correlation between the proportion of Blacks/African Americans and percentage of population with at least 5th grade education in the United States with a correlation coefficient (R) of 0.398 and weighted average of 97.3%. Similarly, the statistical analysis conducted on geographies consisting of 231,142,814 people shows a mild positive correlation between the proportion of Apache and percentage of population with at least 5th grade education in the United States with a correlation coefficient (R) of 0.342 and weighted average of 97.4%, a difference of 0.11%.
5th Grade Correlation Summary
| Measurement | Black/African American | Apache |
| Minimum | 95.5% | 92.5% |
| Maximum | 99.0% | 100.0% |
| Range | 3.5% | 7.5% |
| Mean | 97.4% | 98.6% |
| Median | 97.5% | 99.0% |
| Interquartile 25% (IQ1) | 97.0% | 97.7% |
| Interquartile 75% (IQ3) | 97.9% | 100.0% |
| Interquartile Range (IQR) | 0.85% | 2.3% |
| Standard Deviation (Sample) | 0.59% | 1.6% |
| Standard Deviation (Population) | 0.59% | 1.6% |
Similar Demographics by 5th Grade
Demographics Similar to Blacks/African Americans by 5th Grade
In terms of 5th grade, the demographic groups most similar to Blacks/African Americans are Immigrants from Brazil (97.3%, a difference of 0.0%), Panamanian (97.3%, a difference of 0.0%), Spanish American (97.3%, a difference of 0.010%), Paraguayan (97.3%, a difference of 0.010%), and Immigrants from Egypt (97.3%, a difference of 0.010%).
| Demographics | Rating | Rank | 5th Grade |
| Immigrants | Ukraine | 38.6 /100 | #183 | Fair 97.3% |
| Immigrants | Venezuela | 38.4 /100 | #184 | Fair 97.3% |
| Dutch West Indians | 36.2 /100 | #185 | Fair 97.3% |
| Immigrants | Argentina | 36.1 /100 | #186 | Fair 97.3% |
| Spanish Americans | 34.7 /100 | #187 | Fair 97.3% |
| Paraguayans | 33.7 /100 | #188 | Fair 97.3% |
| Immigrants | Egypt | 32.9 /100 | #189 | Fair 97.3% |
| Blacks/African Americans | 31.8 /100 | #190 | Fair 97.3% |
| Immigrants | Brazil | 31.5 /100 | #191 | Fair 97.3% |
| Panamanians | 31.3 /100 | #192 | Fair 97.3% |
| Navajo | 29.0 /100 | #193 | Fair 97.2% |
| Immigrants | Albania | 28.5 /100 | #194 | Fair 97.2% |
| Guamanians/Chamorros | 26.8 /100 | #195 | Fair 97.2% |
| Hawaiians | 25.6 /100 | #196 | Fair 97.2% |
| Brazilians | 25.4 /100 | #197 | Fair 97.2% |
Demographics Similar to Apache by 5th Grade
In terms of 5th grade, the demographic groups most similar to Apache are Immigrants from Poland (97.4%, a difference of 0.0%), Kenyan (97.4%, a difference of 0.010%), Immigrants from Iran (97.4%, a difference of 0.010%), Ugandan (97.4%, a difference of 0.010%), and Bermudan (97.4%, a difference of 0.010%).
| Demographics | Rating | Rank | 5th Grade |
| Immigrants | Italy | 65.2 /100 | #159 | Good 97.4% |
| Marshallese | 61.2 /100 | #160 | Good 97.4% |
| Kenyans | 59.7 /100 | #161 | Average 97.4% |
| Immigrants | Iran | 59.5 /100 | #162 | Average 97.4% |
| Ugandans | 58.9 /100 | #163 | Average 97.4% |
| Bermudans | 58.8 /100 | #164 | Average 97.4% |
| Immigrants | Poland | 57.9 /100 | #165 | Average 97.4% |
| Apache | 57.2 /100 | #166 | Average 97.4% |
| Immigrants | Belarus | 54.6 /100 | #167 | Average 97.3% |
| Chileans | 54.5 /100 | #168 | Average 97.3% |
| Immigrants | Korea | 54.1 /100 | #169 | Average 97.3% |
| Venezuelans | 54.0 /100 | #170 | Average 97.3% |
| Immigrants | Sri Lanka | 53.8 /100 | #171 | Average 97.3% |
| Arabs | 53.4 /100 | #172 | Average 97.3% |
| Egyptians | 52.4 /100 | #173 | Average 97.3% |