Black/African American vs Apache Seniors Poverty Over the Age of 65
COMPARE
Black/African American
Apache
Seniors Poverty Over the Age of 65
Seniors Poverty Over the Age of 65 Comparison
Blacks/African Americans
Apache
13.7%
SENIORS POVERTY OVER THE AGE OF 65
0.0/ 100
METRIC RATING
291st/ 347
METRIC RANK
13.9%
SENIORS POVERTY OVER THE AGE OF 65
0.0/ 100
METRIC RATING
295th/ 347
METRIC RANK
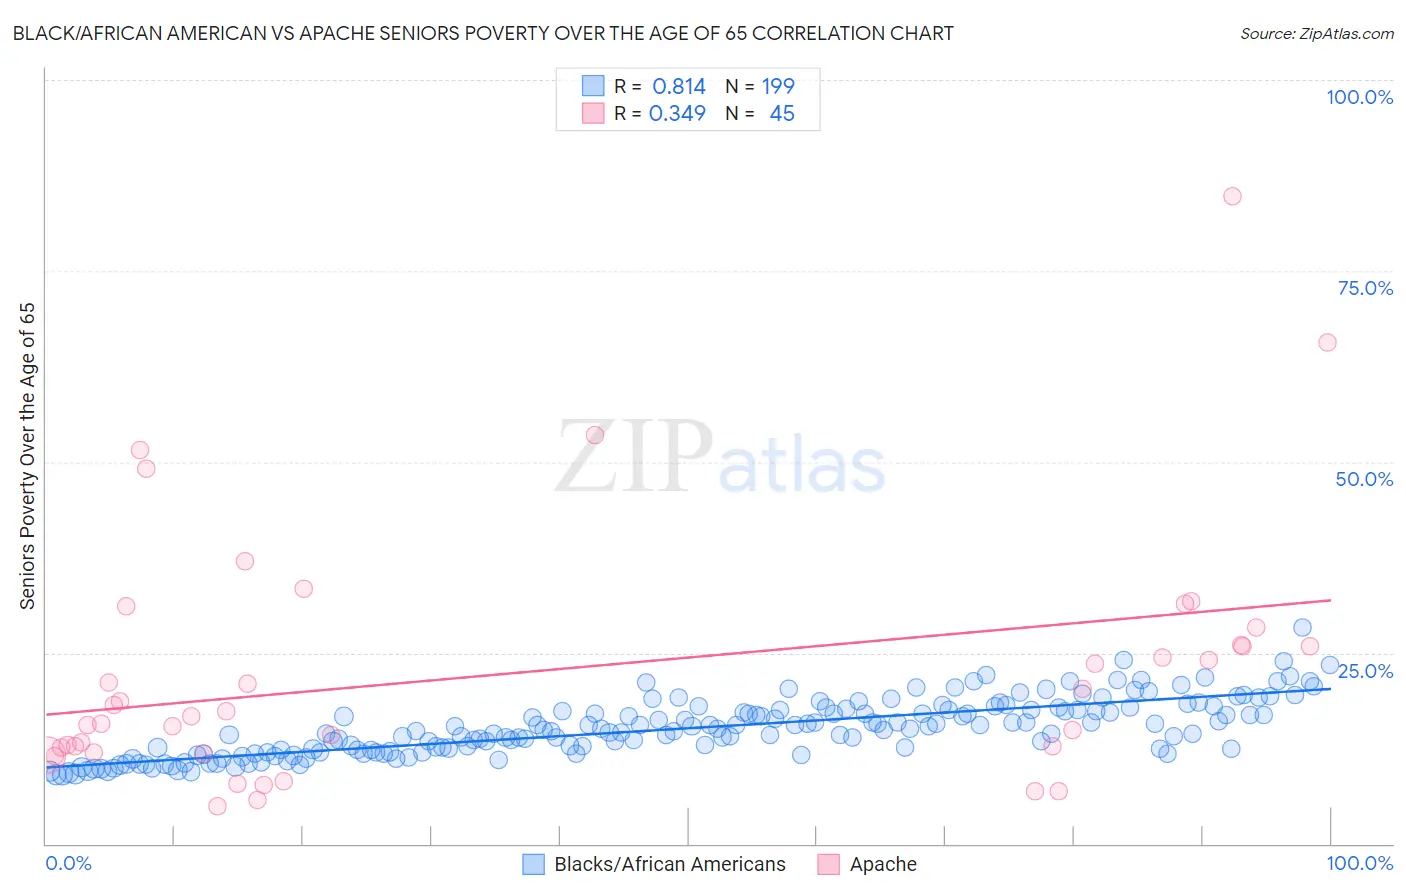
Black/African American vs Apache Seniors Poverty Over the Age of 65 Correlation Chart
The statistical analysis conducted on geographies consisting of 561,317,692 people shows a very strong positive correlation between the proportion of Blacks/African Americans and poverty level among seniors over the age of 65 in the United States with a correlation coefficient (R) of 0.814 and weighted average of 13.7%. Similarly, the statistical analysis conducted on geographies consisting of 230,541,772 people shows a mild positive correlation between the proportion of Apache and poverty level among seniors over the age of 65 in the United States with a correlation coefficient (R) of 0.349 and weighted average of 13.9%, a difference of 1.5%.
Seniors Poverty Over the Age of 65 Correlation Summary
| Measurement | Black/African American | Apache |
| Minimum | 9.0% | 4.9% |
| Maximum | 28.3% | 84.8% |
| Range | 19.3% | 79.9% |
| Mean | 15.1% | 22.6% |
| Median | 14.8% | 17.3% |
| Interquartile 25% (IQ1) | 12.0% | 12.3% |
| Interquartile 75% (IQ3) | 17.5% | 27.1% |
| Interquartile Range (IQR) | 5.5% | 14.8% |
| Standard Deviation (Sample) | 3.6% | 16.5% |
| Standard Deviation (Population) | 3.6% | 16.3% |
Demographics Similar to Blacks/African Americans and Apache by Seniors Poverty Over the Age of 65
In terms of seniors poverty over the age of 65, the demographic groups most similar to Blacks/African Americans are Jamaican (13.6%, a difference of 0.46%), Immigrants from Central America (13.6%, a difference of 0.46%), Spanish American Indian (13.8%, a difference of 0.69%), Belizean (13.6%, a difference of 0.73%), and Immigrants from Mexico (13.6%, a difference of 0.87%). Similarly, the demographic groups most similar to Apache are Cheyenne (13.9%, a difference of 0.19%), Immigrants from Jamaica (13.9%, a difference of 0.27%), Vietnamese (14.0%, a difference of 0.34%), Immigrants from Guatemala (13.8%, a difference of 0.61%), and Immigrants from Belize (14.0%, a difference of 0.63%).
| Demographics | Rating | Rank | Seniors Poverty Over the Age of 65 |
| Central Americans | 0.0 /100 | #283 | Tragic 13.4% |
| Colville | 0.0 /100 | #284 | Tragic 13.5% |
| Guatemalans | 0.0 /100 | #285 | Tragic 13.5% |
| Immigrants | Senegal | 0.0 /100 | #286 | Tragic 13.6% |
| Immigrants | Mexico | 0.0 /100 | #287 | Tragic 13.6% |
| Belizeans | 0.0 /100 | #288 | Tragic 13.6% |
| Jamaicans | 0.0 /100 | #289 | Tragic 13.6% |
| Immigrants | Central America | 0.0 /100 | #290 | Tragic 13.6% |
| Blacks/African Americans | 0.0 /100 | #291 | Tragic 13.7% |
| Spanish American Indians | 0.0 /100 | #292 | Tragic 13.8% |
| Immigrants | Guatemala | 0.0 /100 | #293 | Tragic 13.8% |
| Cheyenne | 0.0 /100 | #294 | Tragic 13.9% |
| Apache | 0.0 /100 | #295 | Tragic 13.9% |
| Immigrants | Jamaica | 0.0 /100 | #296 | Tragic 13.9% |
| Vietnamese | 0.0 /100 | #297 | Tragic 14.0% |
| Immigrants | Belize | 0.0 /100 | #298 | Tragic 14.0% |
| Ecuadorians | 0.0 /100 | #299 | Tragic 14.0% |
| Immigrants | Uzbekistan | 0.0 /100 | #300 | Tragic 14.0% |
| U.S. Virgin Islanders | 0.0 /100 | #301 | Tragic 14.0% |
| Yup'ik | 0.0 /100 | #302 | Tragic 14.1% |
| Immigrants | Bangladesh | 0.0 /100 | #303 | Tragic 14.1% |