Bhutanese vs Slavic Householder Income Ages 25 - 44 years
COMPARE
Bhutanese
Slavic
Householder Income Ages 25 - 44 years
Householder Income Ages 25 - 44 years Comparison
Bhutanese
Slavs
$109,520
HOUSEHOLDER INCOME AGES 25 - 44 YEARS
100.0/ 100
METRIC RATING
33rd/ 347
METRIC RANK
$96,377
HOUSEHOLDER INCOME AGES 25 - 44 YEARS
73.2/ 100
METRIC RATING
154th/ 347
METRIC RANK
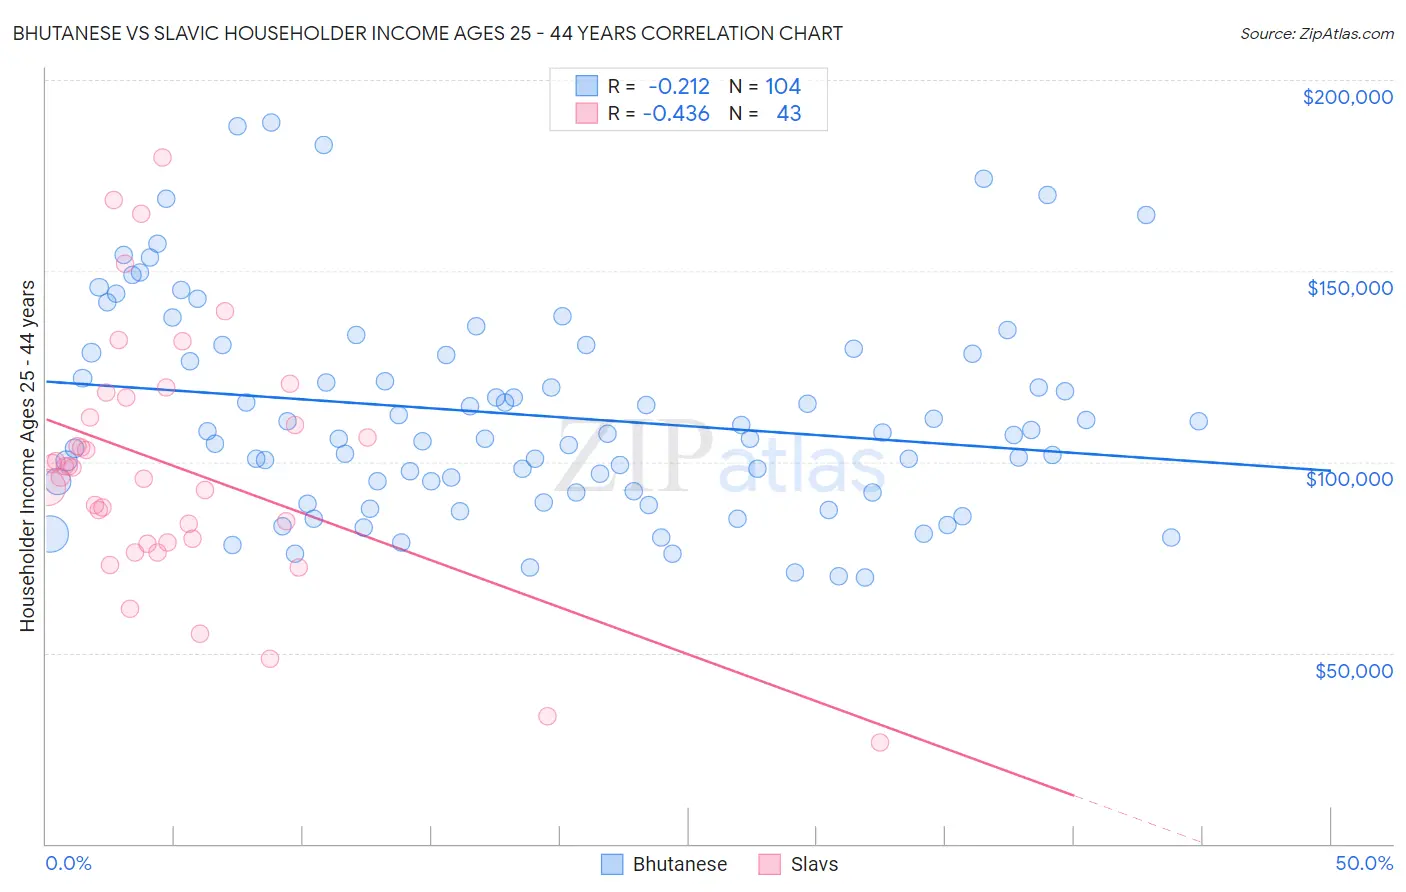
Bhutanese vs Slavic Householder Income Ages 25 - 44 years Correlation Chart
The statistical analysis conducted on geographies consisting of 454,022,239 people shows a weak negative correlation between the proportion of Bhutanese and household income with householder between the ages 25 and 44 in the United States with a correlation coefficient (R) of -0.212 and weighted average of $109,520. Similarly, the statistical analysis conducted on geographies consisting of 270,306,430 people shows a moderate negative correlation between the proportion of Slavs and household income with householder between the ages 25 and 44 in the United States with a correlation coefficient (R) of -0.436 and weighted average of $96,377, a difference of 13.6%.
Householder Income Ages 25 - 44 years Correlation Summary
| Measurement | Bhutanese | Slavic |
| Minimum | $69,864 | $26,507 |
| Maximum | $188,962 | $179,830 |
| Range | $119,098 | $153,323 |
| Mean | $112,280 | $98,780 |
| Median | $107,164 | $98,521 |
| Interquartile 25% (IQ1) | $92,216 | $78,750 |
| Interquartile 75% (IQ3) | $128,400 | $116,887 |
| Interquartile Range (IQR) | $36,183 | $38,137 |
| Standard Deviation (Sample) | $27,356 | $32,452 |
| Standard Deviation (Population) | $27,224 | $32,072 |
Similar Demographics by Householder Income Ages 25 - 44 years
Demographics Similar to Bhutanese by Householder Income Ages 25 - 44 years
In terms of householder income ages 25 - 44 years, the demographic groups most similar to Bhutanese are Bolivian ($109,372, a difference of 0.13%), Immigrants from Sri Lanka ($109,741, a difference of 0.20%), Immigrants from Switzerland ($109,185, a difference of 0.31%), Maltese ($110,064, a difference of 0.50%), and Immigrants from Greece ($110,103, a difference of 0.53%).
| Demographics | Rating | Rank | Householder Income Ages 25 - 44 years |
| Immigrants | Asia | 100.0 /100 | #26 | Exceptional $110,787 |
| Russians | 100.0 /100 | #27 | Exceptional $110,398 |
| Immigrants | Denmark | 100.0 /100 | #28 | Exceptional $110,363 |
| Turks | 100.0 /100 | #29 | Exceptional $110,318 |
| Immigrants | Greece | 100.0 /100 | #30 | Exceptional $110,103 |
| Maltese | 100.0 /100 | #31 | Exceptional $110,064 |
| Immigrants | Sri Lanka | 100.0 /100 | #32 | Exceptional $109,741 |
| Bhutanese | 100.0 /100 | #33 | Exceptional $109,520 |
| Bolivians | 100.0 /100 | #34 | Exceptional $109,372 |
| Immigrants | Switzerland | 100.0 /100 | #35 | Exceptional $109,185 |
| Latvians | 100.0 /100 | #36 | Exceptional $108,926 |
| Immigrants | Russia | 100.0 /100 | #37 | Exceptional $108,751 |
| Soviet Union | 100.0 /100 | #38 | Exceptional $108,457 |
| Immigrants | France | 99.9 /100 | #39 | Exceptional $108,257 |
| Immigrants | Lithuania | 99.9 /100 | #40 | Exceptional $108,149 |
Demographics Similar to Slavs by Householder Income Ages 25 - 44 years
In terms of householder income ages 25 - 44 years, the demographic groups most similar to Slavs are Slovene ($96,439, a difference of 0.060%), South American Indian ($96,497, a difference of 0.12%), Czech ($96,525, a difference of 0.15%), Moroccan ($96,117, a difference of 0.27%), and Ugandan ($96,667, a difference of 0.30%).
| Demographics | Rating | Rank | Householder Income Ages 25 - 44 years |
| Immigrants | Syria | 77.4 /100 | #147 | Good $96,789 |
| Irish | 76.9 /100 | #148 | Good $96,730 |
| Basques | 76.6 /100 | #149 | Good $96,709 |
| Ugandans | 76.2 /100 | #150 | Good $96,667 |
| Czechs | 74.8 /100 | #151 | Good $96,525 |
| South American Indians | 74.5 /100 | #152 | Good $96,497 |
| Slovenes | 73.9 /100 | #153 | Good $96,439 |
| Slavs | 73.2 /100 | #154 | Good $96,377 |
| Moroccans | 70.3 /100 | #155 | Good $96,117 |
| Immigrants | Germany | 67.9 /100 | #156 | Good $95,913 |
| Immigrants | Uganda | 65.2 /100 | #157 | Good $95,698 |
| Scandinavians | 63.9 /100 | #158 | Good $95,596 |
| Costa Ricans | 63.5 /100 | #159 | Good $95,565 |
| Icelanders | 63.4 /100 | #160 | Good $95,560 |
| Immigrants | Portugal | 62.8 /100 | #161 | Good $95,512 |