Bhutanese vs Slavic Median Female Earnings
COMPARE
Bhutanese
Slavic
Median Female Earnings
Median Female Earnings Comparison
Bhutanese
Slavs
$43,648
MEDIAN FEMALE EARNINGS
100.0/ 100
METRIC RATING
41st/ 347
METRIC RANK
$39,613
MEDIAN FEMALE EARNINGS
45.6/ 100
METRIC RATING
178th/ 347
METRIC RANK
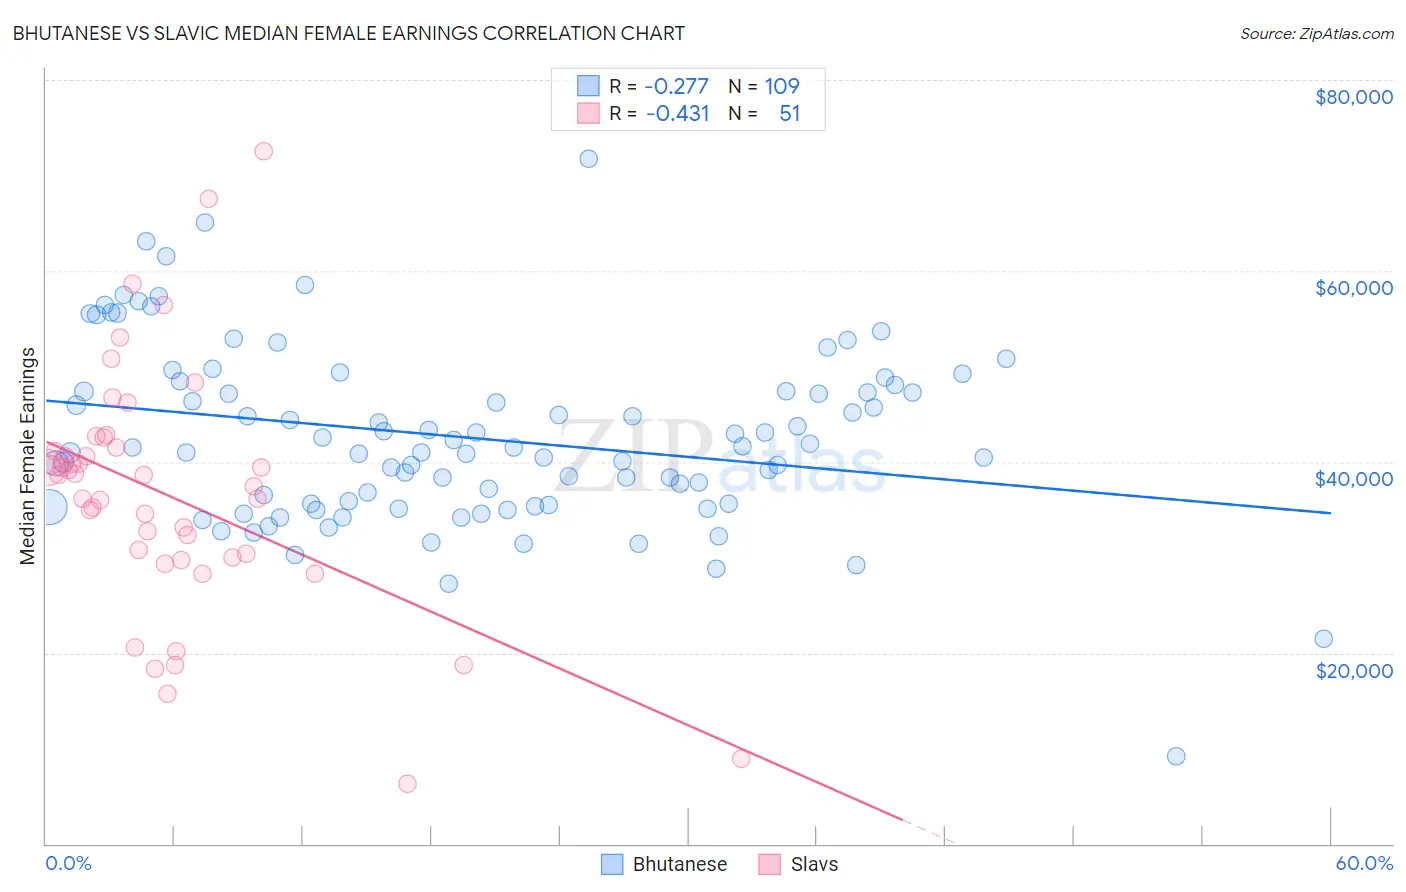
Bhutanese vs Slavic Median Female Earnings Correlation Chart
The statistical analysis conducted on geographies consisting of 455,317,651 people shows a weak negative correlation between the proportion of Bhutanese and median female earnings in the United States with a correlation coefficient (R) of -0.277 and weighted average of $43,648. Similarly, the statistical analysis conducted on geographies consisting of 270,801,270 people shows a moderate negative correlation between the proportion of Slavs and median female earnings in the United States with a correlation coefficient (R) of -0.431 and weighted average of $39,613, a difference of 10.2%.
Median Female Earnings Correlation Summary
| Measurement | Bhutanese | Slavic |
| Minimum | $9,128 | $6,250 |
| Maximum | $71,714 | $72,578 |
| Range | $62,586 | $66,328 |
| Mean | $42,541 | $36,620 |
| Median | $41,499 | $38,590 |
| Interquartile 25% (IQ1) | $35,543 | $30,000 |
| Interquartile 75% (IQ3) | $47,695 | $41,444 |
| Interquartile Range (IQR) | $12,153 | $11,444 |
| Standard Deviation (Sample) | $9,433 | $12,835 |
| Standard Deviation (Population) | $9,390 | $12,708 |
Similar Demographics by Median Female Earnings
Demographics Similar to Bhutanese by Median Female Earnings
In terms of median female earnings, the demographic groups most similar to Bhutanese are Immigrants from Denmark ($43,646, a difference of 0.0%), Bulgarian ($43,638, a difference of 0.020%), Immigrants from Czechoslovakia ($43,571, a difference of 0.18%), Immigrants from Europe ($43,523, a difference of 0.29%), and Immigrants from Bolivia ($43,467, a difference of 0.42%).
| Demographics | Rating | Rank | Median Female Earnings |
| Russians | 100.0 /100 | #34 | Exceptional $44,169 |
| Immigrants | Sri Lanka | 100.0 /100 | #35 | Exceptional $44,161 |
| Immigrants | Turkey | 100.0 /100 | #36 | Exceptional $44,066 |
| Immigrants | Switzerland | 100.0 /100 | #37 | Exceptional $43,996 |
| Latvians | 100.0 /100 | #38 | Exceptional $43,941 |
| Israelis | 100.0 /100 | #39 | Exceptional $43,852 |
| Immigrants | Malaysia | 100.0 /100 | #40 | Exceptional $43,835 |
| Bhutanese | 100.0 /100 | #41 | Exceptional $43,648 |
| Immigrants | Denmark | 100.0 /100 | #42 | Exceptional $43,646 |
| Bulgarians | 100.0 /100 | #43 | Exceptional $43,638 |
| Immigrants | Czechoslovakia | 100.0 /100 | #44 | Exceptional $43,571 |
| Immigrants | Europe | 100.0 /100 | #45 | Exceptional $43,523 |
| Immigrants | Bolivia | 100.0 /100 | #46 | Exceptional $43,467 |
| Bolivians | 100.0 /100 | #47 | Exceptional $43,445 |
| Immigrants | Indonesia | 100.0 /100 | #48 | Exceptional $43,412 |
Demographics Similar to Slavs by Median Female Earnings
In terms of median female earnings, the demographic groups most similar to Slavs are Costa Rican ($39,622, a difference of 0.020%), Immigrants from Germany ($39,603, a difference of 0.030%), Nigerian ($39,641, a difference of 0.070%), Immigrants from South America ($39,643, a difference of 0.080%), and Immigrants from Kenya ($39,535, a difference of 0.20%).
| Demographics | Rating | Rank | Median Female Earnings |
| Immigrants | Portugal | 54.7 /100 | #171 | Average $39,788 |
| British | 53.8 /100 | #172 | Average $39,772 |
| Canadians | 51.4 /100 | #173 | Average $39,724 |
| South Americans | 50.0 /100 | #174 | Average $39,698 |
| Immigrants | South America | 47.2 /100 | #175 | Average $39,643 |
| Nigerians | 47.0 /100 | #176 | Average $39,641 |
| Costa Ricans | 46.1 /100 | #177 | Average $39,622 |
| Slavs | 45.6 /100 | #178 | Average $39,613 |
| Immigrants | Germany | 45.1 /100 | #179 | Average $39,603 |
| Immigrants | Kenya | 41.6 /100 | #180 | Average $39,535 |
| Tsimshian | 41.4 /100 | #181 | Average $39,530 |
| Tlingit-Haida | 40.5 /100 | #182 | Average $39,513 |
| Hungarians | 40.3 /100 | #183 | Average $39,510 |
| Europeans | 37.7 /100 | #184 | Fair $39,457 |
| Immigrants | West Indies | 36.9 /100 | #185 | Fair $39,441 |