Bhutanese vs Immigrants from Nigeria Associate's Degree

COMPARE

Bhutanese
Race
Ancestry
AfghanAfricanAlaska NativeAlaskan AthabascanAlbanianAleutAlsatianAmericanApacheArabArapahoArgentineanArmenianAssyrian/Chaldean/SyriacAustralianAustrianBahamianBangladeshiBarbadianBasqueBelgianBelizeanBermudanBhutaneseBlackfeetBolivianBrazilianBritishBritish West IndianBulgarianBurmeseCajunCambodianCanadianCape VerdeanCarpatho RusynCelticCentral AmericanCentral American IndianCherokeeCheyenneChickasawChileanChineseChippewaChoctawColombianColvilleComancheCosta RicanCreeCreekCroatianCrowCubanCypriotCzechCzechoslovakianDanishDelawareDominicanDutchDutch West IndianEastern EuropeanEcuadorianEgyptianEnglishEstonianEthiopianEuropeanFijianFilipinoFinnishFrenchFrench American IndianFrench CanadianGermanGerman RussianGhanaianGreekGuamanian/ChamorroGuatemalanGuyaneseHaitianHmongHonduranHopiHoumaHungarianIcelanderIndian (Asian)IndonesianInupiatIranianIraqiIrishIroquoisIsraeliItalianJamaicanJapaneseJordanianKenyanKiowaKoreanLaotianLatvianLebaneseLiberianLithuanianLumbeeLuxembourgerMacedonianMalaysianMalteseMarshalleseMenomineeMexicanMexican American IndianMongolianMoroccanNative HawaiianNavajoNepaleseNew ZealanderNicaraguanNigerianNorthern EuropeanNorwegianOkinawanOsageOttawaPaiutePakistaniPalestinianPanamanianParaguayanPennsylvania GermanPeruvianPimaPolishPortuguesePotawatomiPuebloPuerto RicanPuget Sound SalishRomanianRussianSalvadoranSamoanScandinavianScotch-IrishScottishSeminoleSenegaleseSerbianShoshoneSierra LeoneanSiouxSlavicSlovakSloveneSomaliSouth AfricanSouth AmericanSouth American IndianSoviet UnionSpaniardSpanishSpanish AmericanSpanish American IndianSri LankanSubsaharan AfricanSudaneseSwedishSwissSyrianTaiwaneseThaiTlingit-HaidaTohono O'OdhamTonganTrinidadian and TobagonianTsimshianTurkishU.S. Virgin IslanderUgandanUkrainianUruguayanUteVenezuelanVietnameseWelshWest IndianYakamaYaquiYugoslavianYumanYup'ikZimbabwean
Immigration
NonimmigrantsImmigrantsAfghanistanAfricaAlbaniaArgentinaArmeniaAsiaAustraliaAustriaBahamasBangladeshBarbadosBelarusBelgiumBelizeBoliviaBosnia and HerzegovinaBrazilBulgariaBurma/MyanmarCabo VerdeCambodiaCameroonCanadaCaribbeanCentral AmericaChileChinaColombiaCongoCosta RicaCroatiaCubaCzechoslovakiaDenmarkDominicaDominican RepublicEastern AfricaEastern AsiaEastern EuropeEcuadorEgyptEl SalvadorEnglandEritreaEthiopiaEuropeFijiFranceGermanyGhanaGreeceGrenadaGuatemalaGuyanaHaitiHondurasHong KongHungaryIndiaIndonesiaIranIraqIrelandIsraelItalyJamaicaJapanJordanKazakhstanKenyaKoreaKuwaitLaosLatin AmericaLatviaLebanonLiberiaLithuaniaMalaysiaMexicoMicronesiaMiddle AfricaMoldovaMoroccoNepalNetherlandsNicaraguaNorth AmericaNorth MacedoniaNorthern AfricaNorthern EuropeNorwayOceaniaPakistanPanamaPeruPhilippinesPolandPortugalRomaniaRussiaSaudi ArabiaScotlandSenegalSerbiaSierra LeoneSingaporeSomaliaSouth AfricaSouth AmericaSouth Central AsiaSouth Eastern AsiaSouthern EuropeSpainSri LankaSt. Vincent and the GrenadinesSudanSwedenSwitzerlandSyriaTaiwanThailandTrinidad and TobagoTurkeyUgandaUkraineUruguayUzbekistanVenezuelaVietnamWest IndiesWestern AfricaWestern AsiaWestern EuropeYemenZaireZimbabweAzores
Immigrants from Nigeria
Race
Ancestry
AfghanAfricanAlaska NativeAlaskan AthabascanAlbanianAleutAlsatianAmericanApacheArabArapahoArgentineanArmenianAssyrian/Chaldean/SyriacAustralianAustrianBahamianBangladeshiBarbadianBasqueBelgianBelizeanBermudanBlackfeetBolivianBrazilianBritishBritish West IndianBulgarianBurmeseCajunCambodianCanadianCape VerdeanCarpatho RusynCelticCentral AmericanCentral American IndianCherokeeCheyenneChickasawChileanChineseChippewaChoctawColombianColvilleComancheCosta RicanCreeCreekCroatianCrowCubanCypriotCzechCzechoslovakianDanishDelawareDominicanDutchDutch West IndianEastern EuropeanEcuadorianEgyptianEnglishEstonianEthiopianEuropeanFijianFilipinoFinnishFrenchFrench American IndianFrench CanadianGermanGerman RussianGhanaianGreekGuamanian/ChamorroGuatemalanGuyaneseHaitianHmongHonduranHopiHoumaHungarianIcelanderIndian (Asian)IndonesianInupiatIranianIraqiIrishIroquoisIsraeliItalianJamaicanJapaneseJordanianKenyanKiowaKoreanLaotianLatvianLebaneseLiberianLithuanianLumbeeLuxembourgerMacedonianMalaysianMalteseMarshalleseMenomineeMexicanMexican American IndianMongolianMoroccanNative HawaiianNavajoNepaleseNew ZealanderNicaraguanNigerianNorthern EuropeanNorwegianOkinawanOsageOttawaPaiutePakistaniPalestinianPanamanianParaguayanPennsylvania GermanPeruvianPimaPolishPortuguesePotawatomiPuebloPuerto RicanPuget Sound SalishRomanianRussianSalvadoranSamoanScandinavianScotch-IrishScottishSeminoleSenegaleseSerbianShoshoneSierra LeoneanSiouxSlavicSlovakSloveneSomaliSouth AfricanSouth AmericanSouth American IndianSoviet UnionSpaniardSpanishSpanish AmericanSpanish American IndianSri LankanSubsaharan AfricanSudaneseSwedishSwissSyrianTaiwaneseThaiTlingit-HaidaTohono O'OdhamTonganTrinidadian and TobagonianTsimshianTurkishU.S. Virgin IslanderUgandanUkrainianUruguayanUteVenezuelanVietnameseWelshWest IndianYakamaYaquiYugoslavianYumanYup'ikZimbabwean
Immigration
NonimmigrantsImmigrantsAfghanistanAfricaAlbaniaArgentinaArmeniaAsiaAustraliaAustriaBahamasBangladeshBarbadosBelarusBelgiumBelizeBoliviaBosnia and HerzegovinaBrazilBulgariaBurma/MyanmarCabo VerdeCambodiaCameroonCanadaCaribbeanCentral AmericaChileChinaColombiaCongoCosta RicaCroatiaCubaCzechoslovakiaDenmarkDominicaDominican RepublicEastern AfricaEastern AsiaEastern EuropeEcuadorEgyptEl SalvadorEnglandEritreaEthiopiaEuropeFijiFranceGermanyGhanaGreeceGrenadaGuatemalaGuyanaHaitiHondurasHong KongHungaryIndiaIndonesiaIranIraqIrelandIsraelItalyJamaicaJapanJordanKazakhstanKenyaKoreaKuwaitLaosLatin AmericaLatviaLebanonLiberiaLithuaniaMalaysiaMexicoMicronesiaMiddle AfricaMoldovaMoroccoNepalNetherlandsNicaraguaNigeriaNorth AmericaNorth MacedoniaNorthern AfricaNorthern EuropeNorwayOceaniaPakistanPanamaPeruPhilippinesPolandPortugalRomaniaRussiaSaudi ArabiaScotlandSenegalSerbiaSierra LeoneSingaporeSomaliaSouth AfricaSouth AmericaSouth Central AsiaSouth Eastern AsiaSouthern EuropeSpainSri LankaSt. Vincent and the GrenadinesSudanSwedenSwitzerlandSyriaTaiwanThailandTrinidad and TobagoTurkeyUgandaUkraineUruguayUzbekistanVenezuelaVietnamWest IndiesWestern AfricaWestern AsiaWestern EuropeYemenZaireZimbabweAzores
Associate's Degree
Income
Poverty
Unemployment
Labor Participation
Family Structure
Vehicle Availability
Education Level
Disability

Associate's Degree Comparison

Bhutanese

Immigrants from Nigeria

Exceptional
Poor
51.4%
ASSOCIATE'S DEGREE
99.7/ 100
METRIC RATING
62nd/ 347
METRIC RANK
44.6%
ASSOCIATE'S DEGREE
11.4/ 100
METRIC RATING
216th/ 347
METRIC RANK

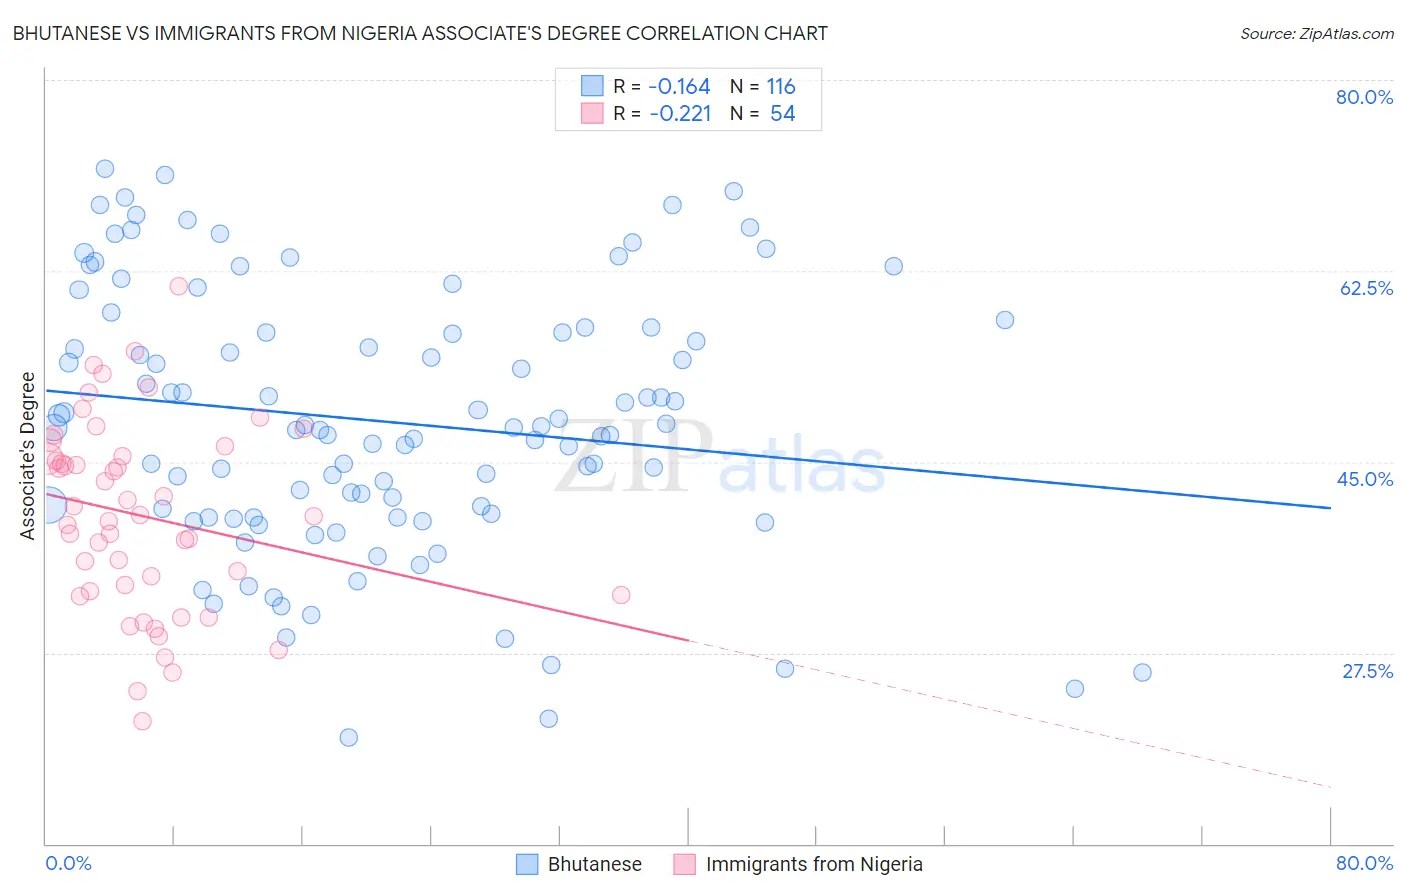
Bhutanese vs Immigrants from Nigeria Associate's Degree Correlation Chart

The statistical analysis conducted on geographies consisting of 455,542,651 people shows a poor negative correlation between the proportion of Bhutanese and percentage of population with at least associate's degree education in the United States with a correlation coefficient (R) of -0.164 and weighted average of 51.4%. Similarly, the statistical analysis conducted on geographies consisting of 283,469,524 people shows a weak negative correlation between the proportion of Immigrants from Nigeria and percentage of population with at least associate's degree education in the United States with a correlation coefficient (R) of -0.221 and weighted average of 44.6%, a difference of 15.3%.
Bhutanese vs Immigrants from Nigeria Associate's Degree

Associate's Degree Correlation Summary

MeasurementBhutaneseImmigrants from Nigeria
Minimum19.7%21.3%
Maximum71.8%61.1%
Range52.1%39.8%
Mean48.7%40.0%
Median48.1%40.0%
Interquartile 25% (IQ1)40.1%33.2%
Interquartile 75% (IQ3)57.0%45.5%
Interquartile Range (IQR)16.9%12.3%
Standard Deviation (Sample)12.0%8.7%
Standard Deviation (Population)12.0%8.6%

Similar Demographics by Associate's Degree

Demographics Similar to Bhutanese by Associate's Degree

In terms of associate's degree, the demographic groups most similar to Bhutanese are Immigrants from Kazakhstan (51.4%, a difference of 0.0%), South African (51.4%, a difference of 0.050%), Immigrants from Netherlands (51.4%, a difference of 0.13%), Immigrants from Bolivia (51.5%, a difference of 0.15%), and Zimbabwean (51.3%, a difference of 0.16%).
DemographicsRating | RankAssociate's Degree
Australians
99.8
/100
|
#55
Exceptional
51.9%
Immigrants | Czechoslovakia
99.8
/100
|
#56
Exceptional
51.9%
Paraguayans
99.8
/100
|
#57
Exceptional
51.8%
New Zealanders
99.8
/100
|
#58
Exceptional
51.8%
Immigrants | Serbia
99.8
/100
|
#59
Exceptional
51.7%
Immigrants | Bolivia
99.7
/100
|
#60
Exceptional
51.5%
Immigrants | Kazakhstan
99.7
/100
|
#61
Exceptional
51.4%
Bhutanese
99.7
/100
|
#62
Exceptional
51.4%
South Africans
99.7
/100
|
#63
Exceptional
51.4%
Immigrants | Netherlands
99.7
/100
|
#64
Exceptional
51.4%
Zimbabweans
99.7
/100
|
#65
Exceptional
51.3%
Immigrants | Europe
99.7
/100
|
#66
Exceptional
51.3%
Argentineans
99.6
/100
|
#67
Exceptional
51.2%
Immigrants | Indonesia
99.5
/100
|
#68
Exceptional
51.0%
Egyptians
99.5
/100
|
#69
Exceptional
50.9%

Demographics Similar to Immigrants from Nigeria by Associate's Degree

In terms of associate's degree, the demographic groups most similar to Immigrants from Nigeria are Immigrants from Panama (44.7%, a difference of 0.18%), Immigrants (44.5%, a difference of 0.19%), Immigrants from Middle Africa (44.7%, a difference of 0.24%), Spanish (44.4%, a difference of 0.43%), and Immigrants from Ghana (44.8%, a difference of 0.49%).
DemographicsRating | RankAssociate's Degree
Immigrants | Costa Rica
16.7
/100
|
#209
Poor
45.0%
Immigrants | Philippines
16.7
/100
|
#210
Poor
45.0%
Immigrants | Zaire
16.6
/100
|
#211
Poor
45.0%
French Canadians
15.0
/100
|
#212
Poor
44.9%
Immigrants | Ghana
14.2
/100
|
#213
Poor
44.8%
Immigrants | Middle Africa
12.7
/100
|
#214
Poor
44.7%
Immigrants | Panama
12.4
/100
|
#215
Poor
44.7%
Immigrants | Nigeria
11.4
/100
|
#216
Poor
44.6%
Immigrants | Immigrants
10.5
/100
|
#217
Poor
44.5%
Spanish
9.4
/100
|
#218
Tragic
44.4%
Whites/Caucasians
7.5
/100
|
#219
Tragic
44.2%
Portuguese
7.2
/100
|
#220
Tragic
44.1%
Immigrants | Western Africa
6.6
/100
|
#221
Tragic
44.1%
Barbadians
5.8
/100
|
#222
Tragic
43.9%
Sub-Saharan Africans
5.5
/100
|
#223
Tragic
43.9%