Bhutanese vs Immigrants from Northern Europe Associate's Degree
COMPARE
Bhutanese
Immigrants from Northern Europe
Associate's Degree
Associate's Degree Comparison
Bhutanese
Immigrants from Northern Europe
51.4%
ASSOCIATE'S DEGREE
99.7/ 100
METRIC RATING
62nd/ 347
METRIC RANK
53.5%
ASSOCIATE'S DEGREE
100.0/ 100
METRIC RATING
31st/ 347
METRIC RANK
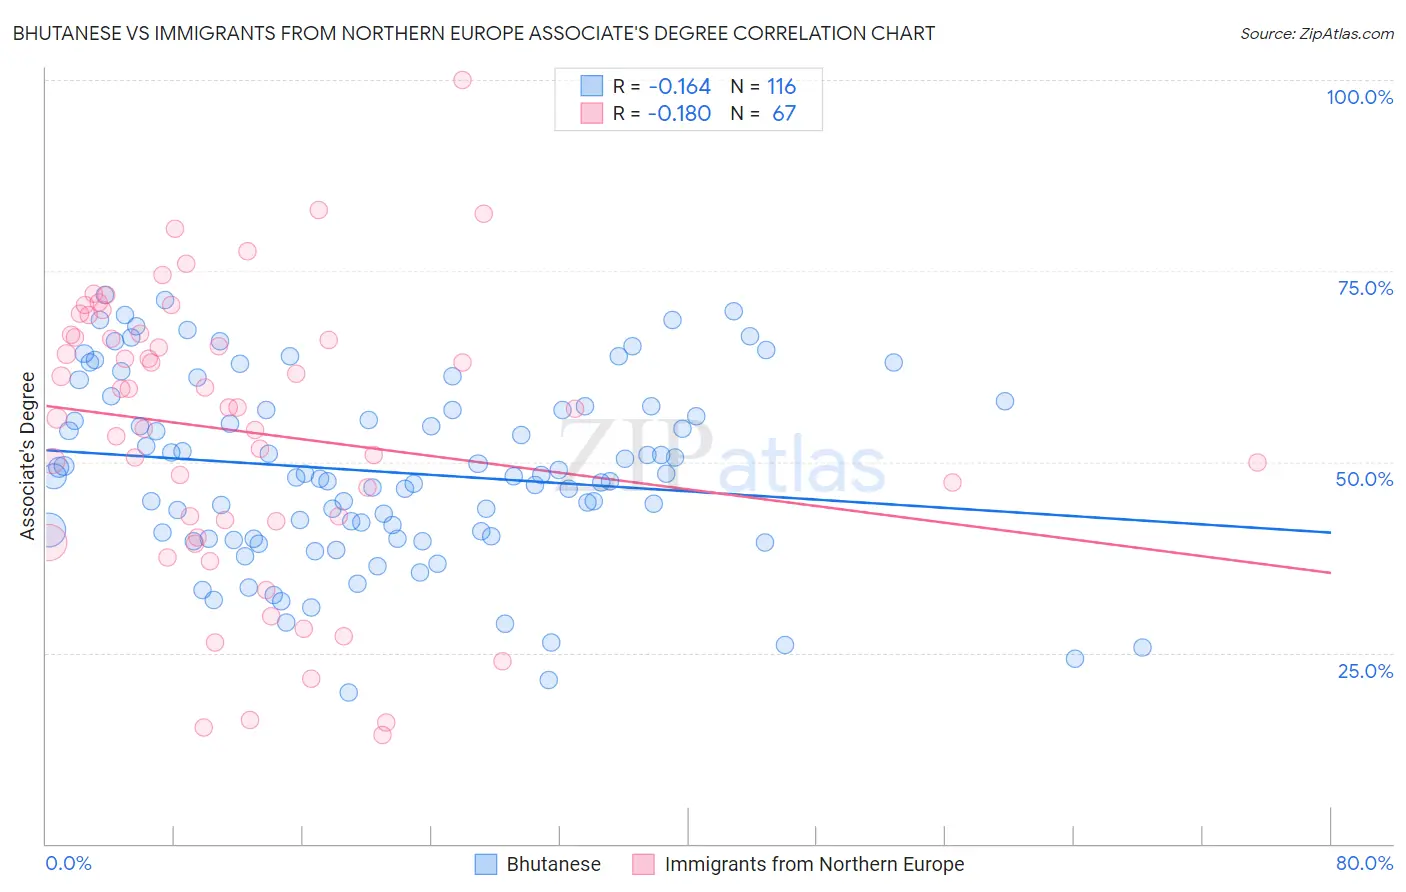
Bhutanese vs Immigrants from Northern Europe Associate's Degree Correlation Chart
The statistical analysis conducted on geographies consisting of 455,542,651 people shows a poor negative correlation between the proportion of Bhutanese and percentage of population with at least associate's degree education in the United States with a correlation coefficient (R) of -0.164 and weighted average of 51.4%. Similarly, the statistical analysis conducted on geographies consisting of 477,200,235 people shows a poor negative correlation between the proportion of Immigrants from Northern Europe and percentage of population with at least associate's degree education in the United States with a correlation coefficient (R) of -0.180 and weighted average of 53.5%, a difference of 4.0%.
Associate's Degree Correlation Summary
| Measurement | Bhutanese | Immigrants from Northern Europe |
| Minimum | 19.7% | 14.3% |
| Maximum | 71.8% | 100.0% |
| Range | 52.1% | 85.7% |
| Mean | 48.7% | 54.0% |
| Median | 48.1% | 57.1% |
| Interquartile 25% (IQ1) | 40.1% | 42.2% |
| Interquartile 75% (IQ3) | 57.0% | 66.6% |
| Interquartile Range (IQR) | 16.9% | 24.4% |
| Standard Deviation (Sample) | 12.0% | 18.6% |
| Standard Deviation (Population) | 12.0% | 18.4% |
Similar Demographics by Associate's Degree
Demographics Similar to Bhutanese by Associate's Degree
In terms of associate's degree, the demographic groups most similar to Bhutanese are Immigrants from Kazakhstan (51.4%, a difference of 0.0%), South African (51.4%, a difference of 0.050%), Immigrants from Netherlands (51.4%, a difference of 0.13%), Immigrants from Bolivia (51.5%, a difference of 0.15%), and Zimbabwean (51.3%, a difference of 0.16%).
| Demographics | Rating | Rank | Associate's Degree |
| Australians | 99.8 /100 | #55 | Exceptional 51.9% |
| Immigrants | Czechoslovakia | 99.8 /100 | #56 | Exceptional 51.9% |
| Paraguayans | 99.8 /100 | #57 | Exceptional 51.8% |
| New Zealanders | 99.8 /100 | #58 | Exceptional 51.8% |
| Immigrants | Serbia | 99.8 /100 | #59 | Exceptional 51.7% |
| Immigrants | Bolivia | 99.7 /100 | #60 | Exceptional 51.5% |
| Immigrants | Kazakhstan | 99.7 /100 | #61 | Exceptional 51.4% |
| Bhutanese | 99.7 /100 | #62 | Exceptional 51.4% |
| South Africans | 99.7 /100 | #63 | Exceptional 51.4% |
| Immigrants | Netherlands | 99.7 /100 | #64 | Exceptional 51.4% |
| Zimbabweans | 99.7 /100 | #65 | Exceptional 51.3% |
| Immigrants | Europe | 99.7 /100 | #66 | Exceptional 51.3% |
| Argentineans | 99.6 /100 | #67 | Exceptional 51.2% |
| Immigrants | Indonesia | 99.5 /100 | #68 | Exceptional 51.0% |
| Egyptians | 99.5 /100 | #69 | Exceptional 50.9% |
Demographics Similar to Immigrants from Northern Europe by Associate's Degree
In terms of associate's degree, the demographic groups most similar to Immigrants from Northern Europe are Immigrants from Turkey (53.4%, a difference of 0.030%), Israeli (53.4%, a difference of 0.15%), Bulgarian (53.3%, a difference of 0.34%), Immigrants from Sri Lanka (53.7%, a difference of 0.36%), and Russian (53.2%, a difference of 0.40%).
| Demographics | Rating | Rank | Associate's Degree |
| Immigrants | Korea | 100.0 /100 | #24 | Exceptional 54.5% |
| Immigrants | Switzerland | 100.0 /100 | #25 | Exceptional 54.5% |
| Immigrants | Belgium | 100.0 /100 | #26 | Exceptional 54.5% |
| Latvians | 100.0 /100 | #27 | Exceptional 53.9% |
| Turks | 100.0 /100 | #28 | Exceptional 53.9% |
| Immigrants | France | 100.0 /100 | #29 | Exceptional 53.9% |
| Immigrants | Sri Lanka | 100.0 /100 | #30 | Exceptional 53.7% |
| Immigrants | Northern Europe | 100.0 /100 | #31 | Exceptional 53.5% |
| Immigrants | Turkey | 100.0 /100 | #32 | Exceptional 53.4% |
| Israelis | 100.0 /100 | #33 | Exceptional 53.4% |
| Bulgarians | 100.0 /100 | #34 | Exceptional 53.3% |
| Russians | 100.0 /100 | #35 | Exceptional 53.2% |
| Immigrants | Russia | 100.0 /100 | #36 | Exceptional 53.1% |
| Immigrants | Denmark | 100.0 /100 | #37 | Exceptional 53.1% |
| Mongolians | 100.0 /100 | #38 | Exceptional 53.0% |