Belgian vs Swedish College, 1 year or more

COMPARE

Belgian
Race
Ancestry
AfghanAfricanAlaska NativeAlaskan AthabascanAlbanianAleutAlsatianAmericanApacheArabArapahoArgentineanArmenianAssyrian/Chaldean/SyriacAustralianAustrianBahamianBangladeshiBarbadianBasqueBelgianBelizeanBermudanBhutaneseBlackfeetBolivianBrazilianBritishBritish West IndianBulgarianBurmeseCajunCambodianCanadianCape VerdeanCarpatho RusynCelticCentral AmericanCentral American IndianCherokeeCheyenneChickasawChileanChineseChippewaChoctawColombianColvilleComancheCosta RicanCreeCreekCroatianCrowCubanCypriotCzechCzechoslovakianDanishDelawareDominicanDutchDutch West IndianEastern EuropeanEcuadorianEgyptianEnglishEstonianEthiopianEuropeanFijianFilipinoFinnishFrenchFrench American IndianFrench CanadianGermanGerman RussianGhanaianGreekGuamanian/ChamorroGuatemalanGuyaneseHaitianHmongHonduranHopiHoumaHungarianIcelanderIndian (Asian)IndonesianInupiatIranianIraqiIrishIroquoisIsraeliItalianJamaicanJapaneseJordanianKenyanKiowaKoreanLaotianLatvianLebaneseLiberianLithuanianLumbeeLuxembourgerMacedonianMalaysianMalteseMarshalleseMenomineeMexicanMexican American IndianMongolianMoroccanNative HawaiianNavajoNepaleseNew ZealanderNicaraguanNigerianNorthern EuropeanNorwegianOkinawanOsageOttawaPaiutePakistaniPalestinianPanamanianParaguayanPennsylvania GermanPeruvianPimaPolishPortuguesePotawatomiPuebloPuerto RicanPuget Sound SalishRomanianRussianSalvadoranSamoanScandinavianScotch-IrishScottishSeminoleSenegaleseSerbianShoshoneSierra LeoneanSiouxSlavicSlovakSloveneSomaliSouth AfricanSouth AmericanSouth American IndianSoviet UnionSpaniardSpanishSpanish AmericanSpanish American IndianSri LankanSubsaharan AfricanSudaneseSwissSyrianTaiwaneseThaiTlingit-HaidaTohono O'OdhamTonganTrinidadian and TobagonianTsimshianTurkishU.S. Virgin IslanderUgandanUkrainianUruguayanUteVenezuelanVietnameseWelshWest IndianYakamaYaquiYugoslavianYumanYup'ikZimbabwean
Immigration
NonimmigrantsImmigrantsAfghanistanAfricaAlbaniaArgentinaArmeniaAsiaAustraliaAustriaBahamasBangladeshBarbadosBelarusBelgiumBelizeBoliviaBosnia and HerzegovinaBrazilBulgariaBurma/MyanmarCabo VerdeCambodiaCameroonCanadaCaribbeanCentral AmericaChileChinaColombiaCongoCosta RicaCroatiaCubaCzechoslovakiaDenmarkDominicaDominican RepublicEastern AfricaEastern AsiaEastern EuropeEcuadorEgyptEl SalvadorEnglandEritreaEthiopiaEuropeFijiFranceGermanyGhanaGreeceGrenadaGuatemalaGuyanaHaitiHondurasHong KongHungaryIndiaIndonesiaIranIraqIrelandIsraelItalyJamaicaJapanJordanKazakhstanKenyaKoreaKuwaitLaosLatin AmericaLatviaLebanonLiberiaLithuaniaMalaysiaMexicoMicronesiaMiddle AfricaMoldovaMoroccoNepalNetherlandsNicaraguaNigeriaNorth AmericaNorth MacedoniaNorthern AfricaNorthern EuropeNorwayOceaniaPakistanPanamaPeruPhilippinesPolandPortugalRomaniaRussiaSaudi ArabiaScotlandSenegalSerbiaSierra LeoneSingaporeSomaliaSouth AfricaSouth AmericaSouth Central AsiaSouth Eastern AsiaSouthern EuropeSpainSri LankaSt. Vincent and the GrenadinesSudanSwedenSwitzerlandSyriaTaiwanThailandTrinidad and TobagoTurkeyUgandaUkraineUruguayUzbekistanVenezuelaVietnamWest IndiesWestern AfricaWestern AsiaWestern EuropeYemenZaireZimbabweAzores
Swedish
Race
Ancestry
AfghanAfricanAlaska NativeAlaskan AthabascanAlbanianAleutAlsatianAmericanApacheArabArapahoArgentineanArmenianAssyrian/Chaldean/SyriacAustralianAustrianBahamianBangladeshiBarbadianBasqueBelizeanBermudanBhutaneseBlackfeetBolivianBrazilianBritishBritish West IndianBulgarianBurmeseCajunCambodianCanadianCape VerdeanCarpatho RusynCelticCentral AmericanCentral American IndianCherokeeCheyenneChickasawChileanChineseChippewaChoctawColombianColvilleComancheCosta RicanCreeCreekCroatianCrowCubanCypriotCzechCzechoslovakianDanishDelawareDominicanDutchDutch West IndianEastern EuropeanEcuadorianEgyptianEnglishEstonianEthiopianEuropeanFijianFilipinoFinnishFrenchFrench American IndianFrench CanadianGermanGerman RussianGhanaianGreekGuamanian/ChamorroGuatemalanGuyaneseHaitianHmongHonduranHopiHoumaHungarianIcelanderIndian (Asian)IndonesianInupiatIranianIraqiIrishIroquoisIsraeliItalianJamaicanJapaneseJordanianKenyanKiowaKoreanLaotianLatvianLebaneseLiberianLithuanianLumbeeLuxembourgerMacedonianMalaysianMalteseMarshalleseMenomineeMexicanMexican American IndianMongolianMoroccanNative HawaiianNavajoNepaleseNew ZealanderNicaraguanNigerianNorthern EuropeanNorwegianOkinawanOsageOttawaPaiutePakistaniPalestinianPanamanianParaguayanPennsylvania GermanPeruvianPimaPolishPortuguesePotawatomiPuebloPuerto RicanPuget Sound SalishRomanianRussianSalvadoranSamoanScandinavianScotch-IrishScottishSeminoleSenegaleseSerbianShoshoneSierra LeoneanSiouxSlavicSlovakSloveneSomaliSouth AfricanSouth AmericanSouth American IndianSoviet UnionSpaniardSpanishSpanish AmericanSpanish American IndianSri LankanSubsaharan AfricanSudaneseSwedishSwissSyrianTaiwaneseThaiTlingit-HaidaTohono O'OdhamTonganTrinidadian and TobagonianTsimshianTurkishU.S. Virgin IslanderUgandanUkrainianUruguayanUteVenezuelanVietnameseWelshWest IndianYakamaYaquiYugoslavianYumanYup'ikZimbabwean
Immigration
NonimmigrantsImmigrantsAfghanistanAfricaAlbaniaArgentinaArmeniaAsiaAustraliaAustriaBahamasBangladeshBarbadosBelarusBelgiumBelizeBoliviaBosnia and HerzegovinaBrazilBulgariaBurma/MyanmarCabo VerdeCambodiaCameroonCanadaCaribbeanCentral AmericaChileChinaColombiaCongoCosta RicaCroatiaCubaCzechoslovakiaDenmarkDominicaDominican RepublicEastern AfricaEastern AsiaEastern EuropeEcuadorEgyptEl SalvadorEnglandEritreaEthiopiaEuropeFijiFranceGermanyGhanaGreeceGrenadaGuatemalaGuyanaHaitiHondurasHong KongHungaryIndiaIndonesiaIranIraqIrelandIsraelItalyJamaicaJapanJordanKazakhstanKenyaKoreaKuwaitLaosLatin AmericaLatviaLebanonLiberiaLithuaniaMalaysiaMexicoMicronesiaMiddle AfricaMoldovaMoroccoNepalNetherlandsNicaraguaNigeriaNorth AmericaNorth MacedoniaNorthern AfricaNorthern EuropeNorwayOceaniaPakistanPanamaPeruPhilippinesPolandPortugalRomaniaRussiaSaudi ArabiaScotlandSenegalSerbiaSierra LeoneSingaporeSomaliaSouth AfricaSouth AmericaSouth Central AsiaSouth Eastern AsiaSouthern EuropeSpainSri LankaSt. Vincent and the GrenadinesSudanSwedenSwitzerlandSyriaTaiwanThailandTrinidad and TobagoTurkeyUgandaUkraineUruguayUzbekistanVenezuelaVietnamWest IndiesWestern AfricaWestern AsiaWestern EuropeYemenZaireZimbabweAzores
College, 1 year or more
Income
Poverty
Unemployment
Labor Participation
Family Structure
Vehicle Availability
Education Level
Disability

College, 1 year or more Comparison

Belgians

Swedes

Average
Exceptional
59.7%
COLLEGE, 1 YEAR OR MORE
58.1/ 100
METRIC RATING
164th/ 347
METRIC RANK
62.1%
COLLEGE, 1 YEAR OR MORE
96.8/ 100
METRIC RATING
101st/ 347
METRIC RANK

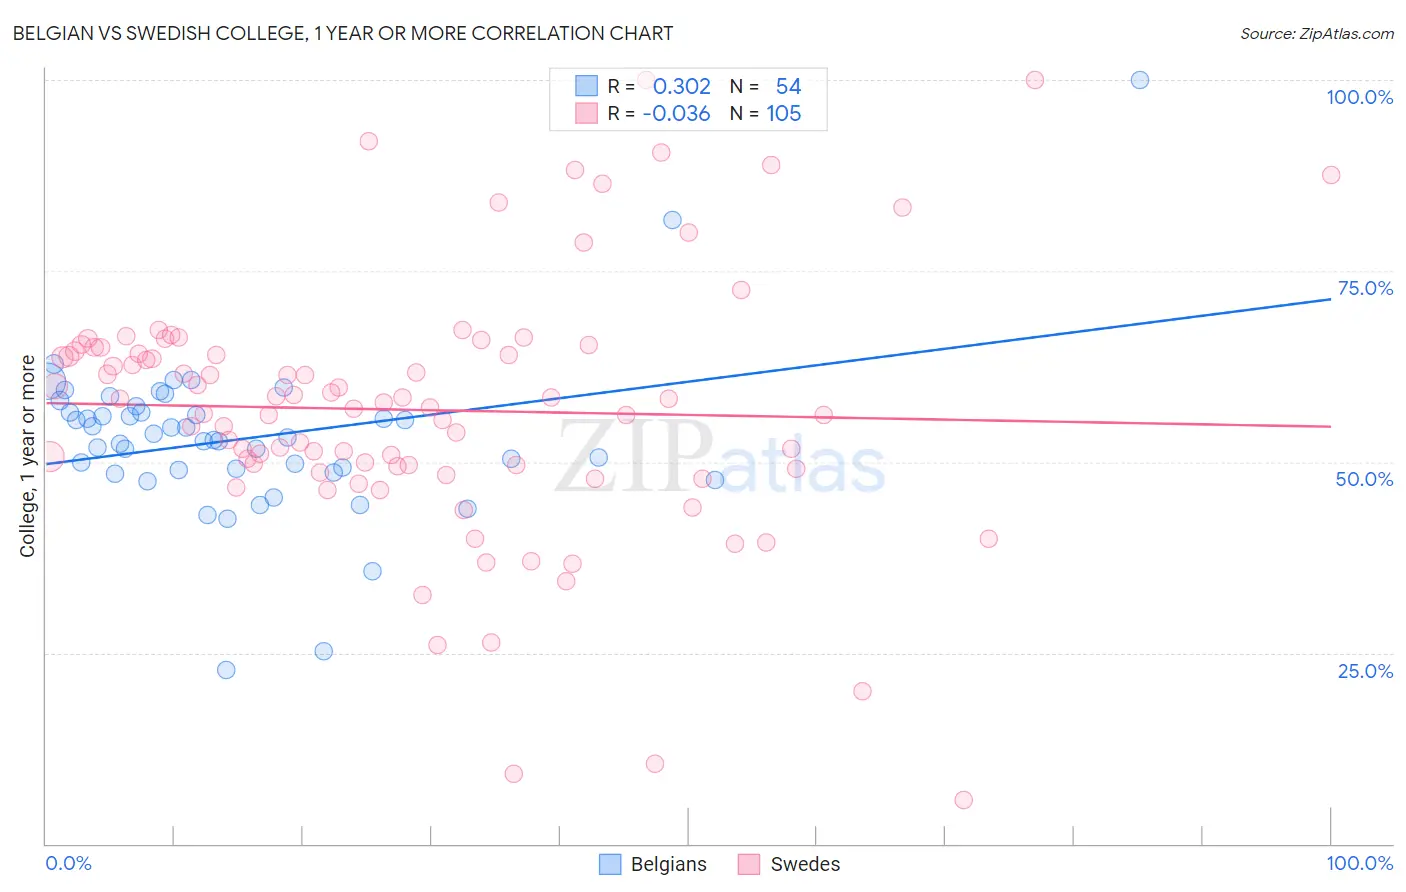
Belgian vs Swedish College, 1 year or more Correlation Chart

The statistical analysis conducted on geographies consisting of 356,017,497 people shows a mild positive correlation between the proportion of Belgians and percentage of population with at least college, 1 year or more education in the United States with a correlation coefficient (R) of 0.302 and weighted average of 59.7%. Similarly, the statistical analysis conducted on geographies consisting of 539,224,370 people shows no correlation between the proportion of Swedes and percentage of population with at least college, 1 year or more education in the United States with a correlation coefficient (R) of -0.036 and weighted average of 62.1%, a difference of 4.1%.
Belgian vs Swedish College, 1 year or more

College, 1 year or more Correlation Summary

MeasurementBelgianSwedish
Minimum22.8%5.7%
Maximum100.0%100.0%
Range77.2%94.3%
Mean53.1%56.8%
Median53.0%57.8%
Interquartile 25% (IQ1)48.9%49.2%
Interquartile 75% (IQ3)56.4%64.7%
Interquartile Range (IQR)7.6%15.5%
Standard Deviation (Sample)10.9%16.9%
Standard Deviation (Population)10.8%16.9%

Similar Demographics by College, 1 year or more

Demographics Similar to Belgians by College, 1 year or more

In terms of college, 1 year or more, the demographic groups most similar to Belgians are Immigrants from Somalia (59.7%, a difference of 0.010%), Korean (59.7%, a difference of 0.020%), Irish (59.6%, a difference of 0.11%), Immigrants from Africa (59.6%, a difference of 0.11%), and Immigrants from North Macedonia (59.5%, a difference of 0.27%).
DemographicsRating | RankCollege, 1 year or more
Immigrants | Armenia
68.8
/100
|
#157
Good
60.0%
English
67.2
/100
|
#158
Good
60.0%
Immigrants | Iraq
67.0
/100
|
#159
Good
60.0%
South American Indians
66.9
/100
|
#160
Good
60.0%
Somalis
64.5
/100
|
#161
Good
59.9%
Koreans
58.5
/100
|
#162
Average
59.7%
Immigrants | Somalia
58.3
/100
|
#163
Average
59.7%
Belgians
58.1
/100
|
#164
Average
59.7%
Irish
56.1
/100
|
#165
Average
59.6%
Immigrants | Africa
56.1
/100
|
#166
Average
59.6%
Immigrants | North Macedonia
53.1
/100
|
#167
Average
59.5%
Hungarians
52.9
/100
|
#168
Average
59.5%
Immigrants | Southern Europe
52.7
/100
|
#169
Average
59.5%
Welsh
52.4
/100
|
#170
Average
59.5%
Immigrants | Albania
52.3
/100
|
#171
Average
59.5%

Demographics Similar to Swedes by College, 1 year or more

In terms of college, 1 year or more, the demographic groups most similar to Swedes are Icelander (62.1%, a difference of 0.0%), Luxembourger (62.1%, a difference of 0.020%), Afghan (62.0%, a difference of 0.13%), Chilean (62.0%, a difference of 0.14%), and Immigrants from Nepal (62.0%, a difference of 0.16%).
DemographicsRating | RankCollege, 1 year or more
Immigrants | Croatia
97.6
/100
|
#94
Exceptional
62.3%
British
97.4
/100
|
#95
Exceptional
62.3%
Chinese
97.2
/100
|
#96
Exceptional
62.2%
Jordanians
97.2
/100
|
#97
Exceptional
62.2%
Carpatho Rusyns
97.2
/100
|
#98
Exceptional
62.2%
Croatians
97.1
/100
|
#99
Exceptional
62.2%
Icelanders
96.8
/100
|
#100
Exceptional
62.1%
Swedes
96.8
/100
|
#101
Exceptional
62.1%
Luxembourgers
96.7
/100
|
#102
Exceptional
62.1%
Afghans
96.4
/100
|
#103
Exceptional
62.0%
Chileans
96.4
/100
|
#104
Exceptional
62.0%
Immigrants | Nepal
96.3
/100
|
#105
Exceptional
62.0%
Palestinians
96.3
/100
|
#106
Exceptional
62.0%
Immigrants | Ukraine
95.8
/100
|
#107
Exceptional
61.9%
Syrians
95.7
/100
|
#108
Exceptional
61.9%