Belgian vs Dutch Doctorate Degree
COMPARE
Belgian
Dutch
Doctorate Degree
Doctorate Degree Comparison
Belgians
Dutch
1.8%
DOCTORATE DEGREE
50.3/ 100
METRIC RATING
172nd/ 347
METRIC RANK
1.8%
DOCTORATE DEGREE
27.4/ 100
METRIC RATING
192nd/ 347
METRIC RANK
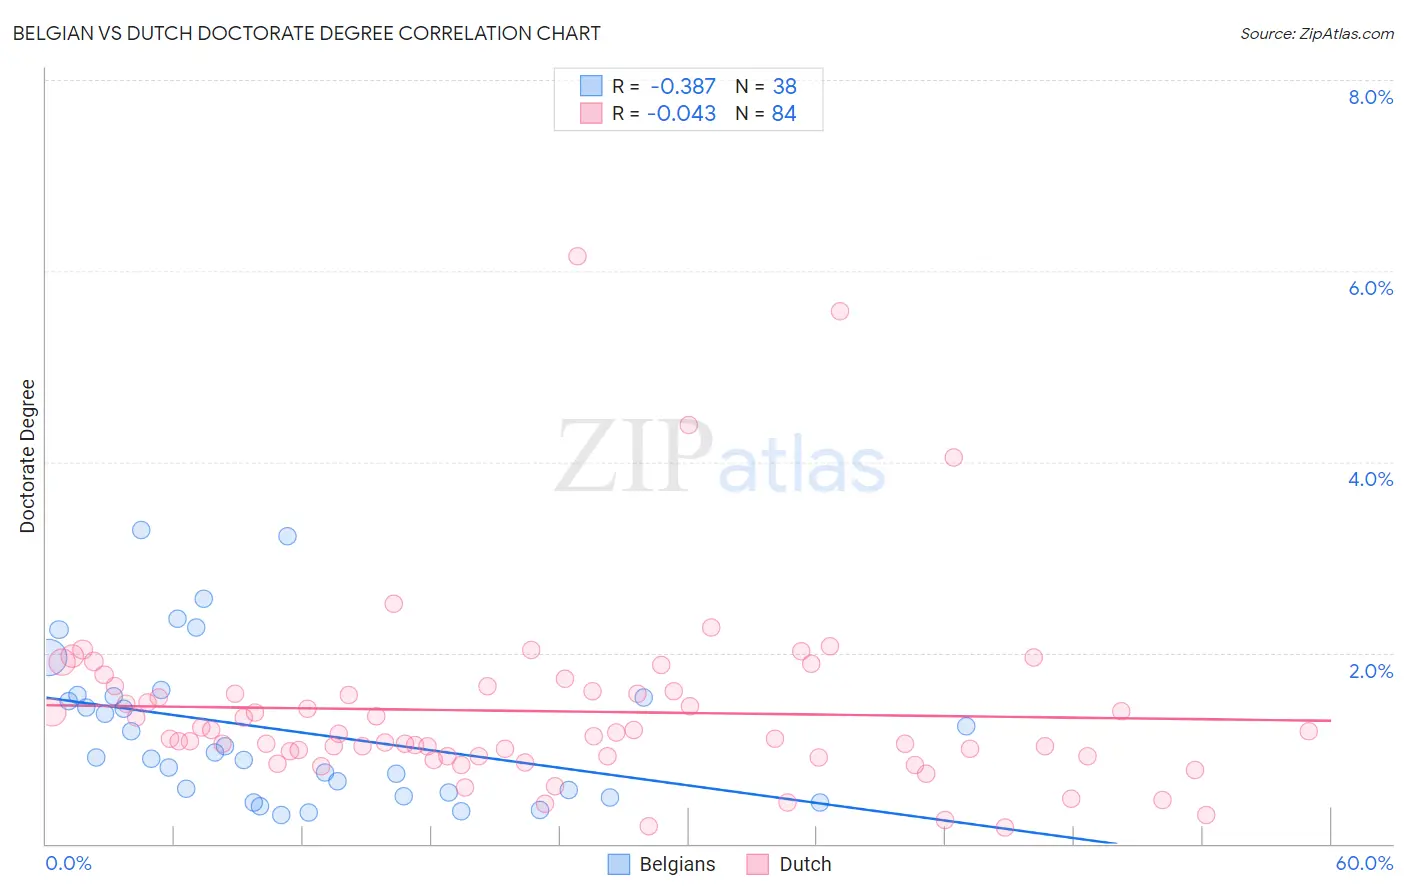
Belgian vs Dutch Doctorate Degree Correlation Chart
The statistical analysis conducted on geographies consisting of 351,946,706 people shows a mild negative correlation between the proportion of Belgians and percentage of population with at least doctorate degree education in the United States with a correlation coefficient (R) of -0.387 and weighted average of 1.8%. Similarly, the statistical analysis conducted on geographies consisting of 532,685,178 people shows no correlation between the proportion of Dutch and percentage of population with at least doctorate degree education in the United States with a correlation coefficient (R) of -0.043 and weighted average of 1.8%, a difference of 3.7%.
Doctorate Degree Correlation Summary
| Measurement | Belgian | Dutch |
| Minimum | 0.30% | 0.18% |
| Maximum | 3.3% | 6.2% |
| Range | 3.0% | 6.0% |
| Mean | 1.2% | 1.4% |
| Median | 0.93% | 1.1% |
| Interquartile 25% (IQ1) | 0.53% | 0.91% |
| Interquartile 75% (IQ3) | 1.5% | 1.6% |
| Interquartile Range (IQR) | 1.0% | 0.68% |
| Standard Deviation (Sample) | 0.80% | 0.98% |
| Standard Deviation (Population) | 0.79% | 0.97% |
Demographics Similar to Belgians and Dutch by Doctorate Degree
In terms of doctorate degree, the demographic groups most similar to Belgians are Norwegian (1.8%, a difference of 0.040%), Immigrants from Bangladesh (1.8%, a difference of 0.040%), Immigrants from Thailand (1.8%, a difference of 0.12%), Spanish (1.8%, a difference of 0.14%), and Iraqi (1.8%, a difference of 0.15%). Similarly, the demographic groups most similar to Dutch are South American (1.8%, a difference of 0.39%), Immigrants from Costa Rica (1.8%, a difference of 0.51%), French Canadian (1.8%, a difference of 0.52%), German (1.8%, a difference of 0.57%), and Czechoslovakian (1.8%, a difference of 1.0%).
| Demographics | Rating | Rank | Doctorate Degree |
| Belgians | 50.3 /100 | #172 | Average 1.8% |
| Norwegians | 50.0 /100 | #173 | Average 1.8% |
| Immigrants | Bangladesh | 50.0 /100 | #174 | Average 1.8% |
| Immigrants | Thailand | 49.4 /100 | #175 | Average 1.8% |
| Spanish | 49.3 /100 | #176 | Average 1.8% |
| Iraqis | 49.2 /100 | #177 | Average 1.8% |
| French | 48.8 /100 | #178 | Average 1.8% |
| Ghanaians | 48.3 /100 | #179 | Average 1.8% |
| Scandinavians | 48.0 /100 | #180 | Average 1.8% |
| Immigrants | Immigrants | 46.2 /100 | #181 | Average 1.8% |
| Immigrants | Afghanistan | 44.3 /100 | #182 | Average 1.8% |
| Finns | 42.1 /100 | #183 | Average 1.8% |
| Nigerians | 39.9 /100 | #184 | Fair 1.8% |
| Slovaks | 36.4 /100 | #185 | Fair 1.8% |
| Peruvians | 34.4 /100 | #186 | Fair 1.8% |
| Czechoslovakians | 33.0 /100 | #187 | Fair 1.8% |
| Germans | 30.5 /100 | #188 | Fair 1.8% |
| French Canadians | 30.2 /100 | #189 | Fair 1.8% |
| Immigrants | Costa Rica | 30.2 /100 | #190 | Fair 1.8% |
| South Americans | 29.5 /100 | #191 | Fair 1.8% |
| Dutch | 27.4 /100 | #192 | Fair 1.8% |