Belgian vs Immigrants from Latvia Professional Degree
COMPARE
Belgian
Immigrants from Latvia
Professional Degree
Professional Degree Comparison
Belgians
Immigrants from Latvia
4.3%
PROFESSIONAL DEGREE
36.2/ 100
METRIC RATING
184th/ 347
METRIC RANK
5.8%
PROFESSIONAL DEGREE
100.0/ 100
METRIC RATING
49th/ 347
METRIC RANK
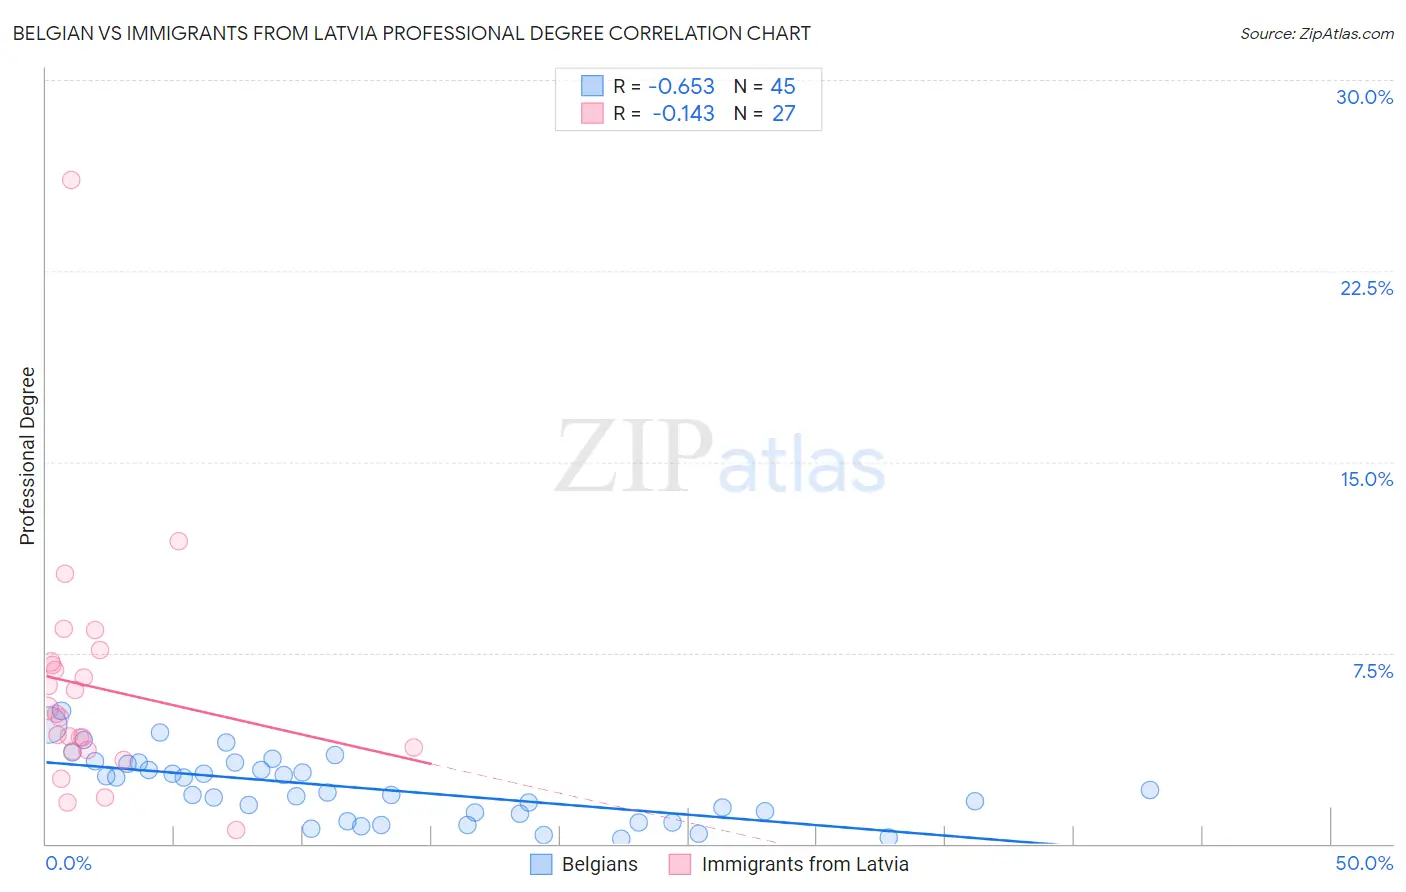
Belgian vs Immigrants from Latvia Professional Degree Correlation Chart
The statistical analysis conducted on geographies consisting of 355,034,789 people shows a significant negative correlation between the proportion of Belgians and percentage of population with at least professional degree education in the United States with a correlation coefficient (R) of -0.653 and weighted average of 4.3%. Similarly, the statistical analysis conducted on geographies consisting of 113,713,162 people shows a poor negative correlation between the proportion of Immigrants from Latvia and percentage of population with at least professional degree education in the United States with a correlation coefficient (R) of -0.143 and weighted average of 5.8%, a difference of 35.3%.
Professional Degree Correlation Summary
| Measurement | Belgian | Immigrants from Latvia |
| Minimum | 0.19% | 0.54% |
| Maximum | 5.2% | 26.1% |
| Range | 5.0% | 25.5% |
| Mean | 2.2% | 6.1% |
| Median | 2.0% | 5.1% |
| Interquartile 25% (IQ1) | 1.0% | 3.7% |
| Interquartile 75% (IQ3) | 3.2% | 7.1% |
| Interquartile Range (IQR) | 2.1% | 3.4% |
| Standard Deviation (Sample) | 1.3% | 4.8% |
| Standard Deviation (Population) | 1.3% | 4.7% |
Similar Demographics by Professional Degree
Demographics Similar to Belgians by Professional Degree
In terms of professional degree, the demographic groups most similar to Belgians are Welsh (4.3%, a difference of 0.060%), Scotch-Irish (4.3%, a difference of 0.32%), Immigrants from Cameroon (4.3%, a difference of 0.47%), Immigrants from Thailand (4.3%, a difference of 0.75%), and Slovak (4.3%, a difference of 0.92%).
| Demographics | Rating | Rank | Professional Degree |
| Celtics | 47.6 /100 | #177 | Average 4.4% |
| Immigrants | Costa Rica | 46.7 /100 | #178 | Average 4.4% |
| Immigrants | Kenya | 45.9 /100 | #179 | Average 4.4% |
| Czechs | 44.9 /100 | #180 | Average 4.4% |
| Danes | 43.5 /100 | #181 | Average 4.4% |
| Immigrants | Immigrants | 43.2 /100 | #182 | Average 4.4% |
| Bermudans | 43.1 /100 | #183 | Average 4.4% |
| Belgians | 36.2 /100 | #184 | Fair 4.3% |
| Welsh | 35.8 /100 | #185 | Fair 4.3% |
| Scotch-Irish | 34.2 /100 | #186 | Fair 4.3% |
| Immigrants | Cameroon | 33.3 /100 | #187 | Fair 4.3% |
| Immigrants | Thailand | 31.7 /100 | #188 | Fair 4.3% |
| Slovaks | 30.7 /100 | #189 | Fair 4.3% |
| Immigrants | Poland | 29.2 /100 | #190 | Fair 4.3% |
| Sri Lankans | 29.0 /100 | #191 | Fair 4.3% |
Demographics Similar to Immigrants from Latvia by Professional Degree
In terms of professional degree, the demographic groups most similar to Immigrants from Latvia are Immigrants from Czechoslovakia (5.8%, a difference of 0.32%), Immigrants from Greece (5.8%, a difference of 0.38%), Paraguayan (5.9%, a difference of 0.40%), Immigrants from Serbia (5.8%, a difference of 0.45%), and Immigrants from Netherlands (5.8%, a difference of 0.68%).
| Demographics | Rating | Rank | Professional Degree |
| Estonians | 100.0 /100 | #42 | Exceptional 6.0% |
| Immigrants | Saudi Arabia | 100.0 /100 | #43 | Exceptional 5.9% |
| Argentineans | 100.0 /100 | #44 | Exceptional 5.9% |
| Immigrants | South Central Asia | 100.0 /100 | #45 | Exceptional 5.9% |
| Immigrants | Argentina | 100.0 /100 | #46 | Exceptional 5.9% |
| Australians | 100.0 /100 | #47 | Exceptional 5.9% |
| Paraguayans | 100.0 /100 | #48 | Exceptional 5.9% |
| Immigrants | Latvia | 100.0 /100 | #49 | Exceptional 5.8% |
| Immigrants | Czechoslovakia | 100.0 /100 | #50 | Exceptional 5.8% |
| Immigrants | Greece | 100.0 /100 | #51 | Exceptional 5.8% |
| Immigrants | Serbia | 100.0 /100 | #52 | Exceptional 5.8% |
| Immigrants | Netherlands | 100.0 /100 | #53 | Exceptional 5.8% |
| Immigrants | Kuwait | 100.0 /100 | #54 | Exceptional 5.7% |
| Immigrants | Western Europe | 100.0 /100 | #55 | Exceptional 5.7% |
| Immigrants | Malaysia | 100.0 /100 | #56 | Exceptional 5.7% |