Belgian vs Brazilian Doctorate Degree
COMPARE
Belgian
Brazilian
Doctorate Degree
Doctorate Degree Comparison
Belgians
Brazilians
1.8%
DOCTORATE DEGREE
50.3/ 100
METRIC RATING
172nd/ 347
METRIC RANK
2.1%
DOCTORATE DEGREE
97.2/ 100
METRIC RATING
110th/ 347
METRIC RANK
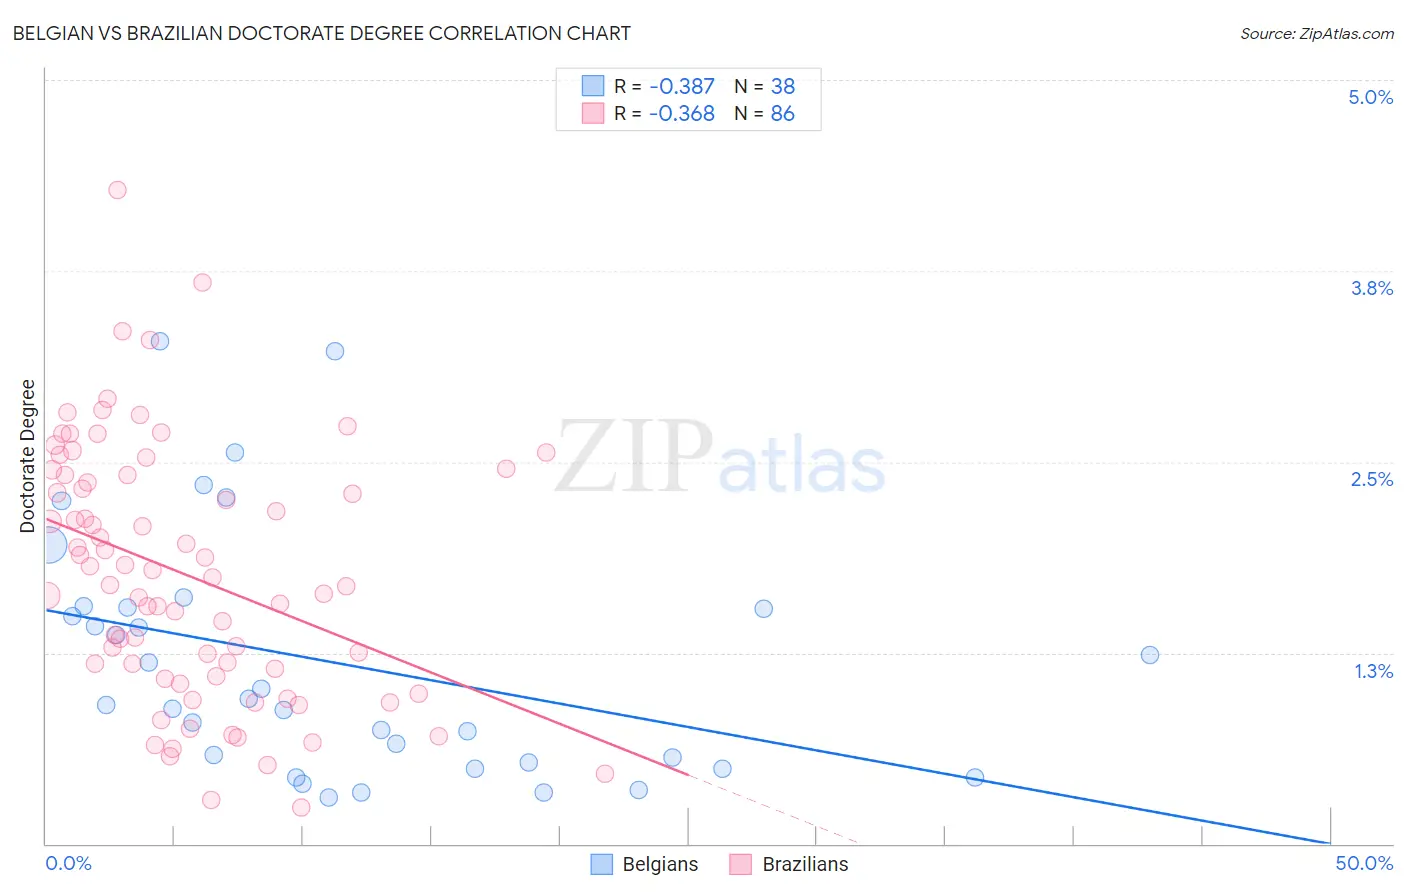
Belgian vs Brazilian Doctorate Degree Correlation Chart
The statistical analysis conducted on geographies consisting of 351,946,706 people shows a mild negative correlation between the proportion of Belgians and percentage of population with at least doctorate degree education in the United States with a correlation coefficient (R) of -0.387 and weighted average of 1.8%. Similarly, the statistical analysis conducted on geographies consisting of 322,140,848 people shows a mild negative correlation between the proportion of Brazilians and percentage of population with at least doctorate degree education in the United States with a correlation coefficient (R) of -0.368 and weighted average of 2.1%, a difference of 12.9%.
Doctorate Degree Correlation Summary
| Measurement | Belgian | Brazilian |
| Minimum | 0.30% | 0.24% |
| Maximum | 3.3% | 4.3% |
| Range | 3.0% | 4.0% |
| Mean | 1.2% | 1.8% |
| Median | 0.93% | 1.7% |
| Interquartile 25% (IQ1) | 0.53% | 1.1% |
| Interquartile 75% (IQ3) | 1.5% | 2.4% |
| Interquartile Range (IQR) | 1.0% | 1.3% |
| Standard Deviation (Sample) | 0.80% | 0.83% |
| Standard Deviation (Population) | 0.79% | 0.82% |
Similar Demographics by Doctorate Degree
Demographics Similar to Belgians by Doctorate Degree
In terms of doctorate degree, the demographic groups most similar to Belgians are Norwegian (1.8%, a difference of 0.040%), Immigrants from Bangladesh (1.8%, a difference of 0.040%), Immigrants from Thailand (1.8%, a difference of 0.12%), Spanish (1.8%, a difference of 0.14%), and Iraqi (1.8%, a difference of 0.15%).
| Demographics | Rating | Rank | Doctorate Degree |
| Scotch-Irish | 63.6 /100 | #165 | Good 1.9% |
| Spaniards | 63.5 /100 | #166 | Good 1.9% |
| Macedonians | 60.9 /100 | #167 | Good 1.9% |
| Sri Lankans | 60.3 /100 | #168 | Good 1.9% |
| Vietnamese | 54.8 /100 | #169 | Average 1.9% |
| Costa Ricans | 53.3 /100 | #170 | Average 1.8% |
| Bermudans | 52.1 /100 | #171 | Average 1.8% |
| Belgians | 50.3 /100 | #172 | Average 1.8% |
| Norwegians | 50.0 /100 | #173 | Average 1.8% |
| Immigrants | Bangladesh | 50.0 /100 | #174 | Average 1.8% |
| Immigrants | Thailand | 49.4 /100 | #175 | Average 1.8% |
| Spanish | 49.3 /100 | #176 | Average 1.8% |
| Iraqis | 49.2 /100 | #177 | Average 1.8% |
| French | 48.8 /100 | #178 | Average 1.8% |
| Ghanaians | 48.3 /100 | #179 | Average 1.8% |
Demographics Similar to Brazilians by Doctorate Degree
In terms of doctorate degree, the demographic groups most similar to Brazilians are Immigrants from Pakistan (2.1%, a difference of 0.060%), Ukrainian (2.1%, a difference of 0.070%), Syrian (2.1%, a difference of 0.080%), Immigrants from Germany (2.1%, a difference of 0.13%), and Immigrants from Italy (2.1%, a difference of 0.29%).
| Demographics | Rating | Rank | Doctorate Degree |
| Romanians | 98.1 /100 | #103 | Exceptional 2.1% |
| Austrians | 98.0 /100 | #104 | Exceptional 2.1% |
| Arabs | 97.8 /100 | #105 | Exceptional 2.1% |
| Sudanese | 97.7 /100 | #106 | Exceptional 2.1% |
| Europeans | 97.5 /100 | #107 | Exceptional 2.1% |
| Immigrants | Germany | 97.3 /100 | #108 | Exceptional 2.1% |
| Ukrainians | 97.2 /100 | #109 | Exceptional 2.1% |
| Brazilians | 97.2 /100 | #110 | Exceptional 2.1% |
| Immigrants | Pakistan | 97.1 /100 | #111 | Exceptional 2.1% |
| Syrians | 97.1 /100 | #112 | Exceptional 2.1% |
| Immigrants | Italy | 96.9 /100 | #113 | Exceptional 2.1% |
| Immigrants | Croatia | 96.8 /100 | #114 | Exceptional 2.1% |
| Taiwanese | 96.7 /100 | #115 | Exceptional 2.1% |
| Maltese | 96.2 /100 | #116 | Exceptional 2.1% |
| Lebanese | 96.0 /100 | #117 | Exceptional 2.1% |