Belgian vs Immigrants from Southern Europe Doctorate Degree
COMPARE
Belgian
Immigrants from Southern Europe
Doctorate Degree
Doctorate Degree Comparison
Belgians
Immigrants from Southern Europe
1.8%
DOCTORATE DEGREE
50.3/ 100
METRIC RATING
172nd/ 347
METRIC RANK
2.0%
DOCTORATE DEGREE
94.7/ 100
METRIC RATING
122nd/ 347
METRIC RANK
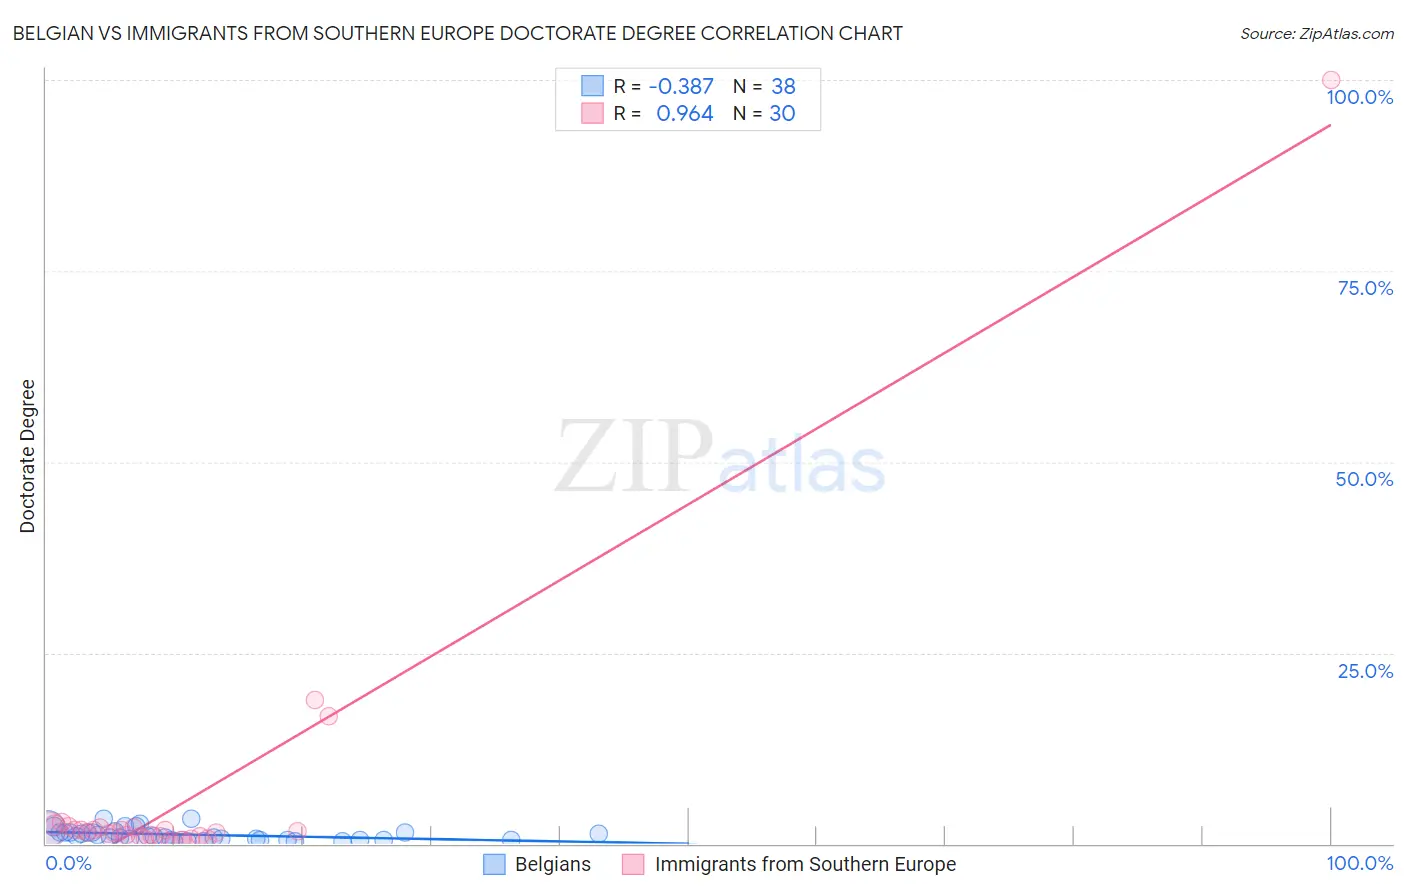
Belgian vs Immigrants from Southern Europe Doctorate Degree Correlation Chart
The statistical analysis conducted on geographies consisting of 351,946,706 people shows a mild negative correlation between the proportion of Belgians and percentage of population with at least doctorate degree education in the United States with a correlation coefficient (R) of -0.387 and weighted average of 1.8%. Similarly, the statistical analysis conducted on geographies consisting of 399,415,289 people shows a perfect positive correlation between the proportion of Immigrants from Southern Europe and percentage of population with at least doctorate degree education in the United States with a correlation coefficient (R) of 0.964 and weighted average of 2.0%, a difference of 10.6%.
Doctorate Degree Correlation Summary
| Measurement | Belgian | Immigrants from Southern Europe |
| Minimum | 0.30% | 0.40% |
| Maximum | 3.3% | 100.0% |
| Range | 3.0% | 99.6% |
| Mean | 1.2% | 5.8% |
| Median | 0.93% | 1.5% |
| Interquartile 25% (IQ1) | 0.53% | 1.0% |
| Interquartile 75% (IQ3) | 1.5% | 2.1% |
| Interquartile Range (IQR) | 1.0% | 1.1% |
| Standard Deviation (Sample) | 0.80% | 18.3% |
| Standard Deviation (Population) | 0.79% | 18.0% |
Similar Demographics by Doctorate Degree
Demographics Similar to Belgians by Doctorate Degree
In terms of doctorate degree, the demographic groups most similar to Belgians are Norwegian (1.8%, a difference of 0.040%), Immigrants from Bangladesh (1.8%, a difference of 0.040%), Immigrants from Thailand (1.8%, a difference of 0.12%), Spanish (1.8%, a difference of 0.14%), and Iraqi (1.8%, a difference of 0.15%).
| Demographics | Rating | Rank | Doctorate Degree |
| Scotch-Irish | 63.6 /100 | #165 | Good 1.9% |
| Spaniards | 63.5 /100 | #166 | Good 1.9% |
| Macedonians | 60.9 /100 | #167 | Good 1.9% |
| Sri Lankans | 60.3 /100 | #168 | Good 1.9% |
| Vietnamese | 54.8 /100 | #169 | Average 1.9% |
| Costa Ricans | 53.3 /100 | #170 | Average 1.8% |
| Bermudans | 52.1 /100 | #171 | Average 1.8% |
| Belgians | 50.3 /100 | #172 | Average 1.8% |
| Norwegians | 50.0 /100 | #173 | Average 1.8% |
| Immigrants | Bangladesh | 50.0 /100 | #174 | Average 1.8% |
| Immigrants | Thailand | 49.4 /100 | #175 | Average 1.8% |
| Spanish | 49.3 /100 | #176 | Average 1.8% |
| Iraqis | 49.2 /100 | #177 | Average 1.8% |
| French | 48.8 /100 | #178 | Average 1.8% |
| Ghanaians | 48.3 /100 | #179 | Average 1.8% |
Demographics Similar to Immigrants from Southern Europe by Doctorate Degree
In terms of doctorate degree, the demographic groups most similar to Immigrants from Southern Europe are Immigrants from Jordan (2.0%, a difference of 0.030%), Croatian (2.0%, a difference of 0.46%), Immigrants from Morocco (2.0%, a difference of 0.50%), Pakistani (2.0%, a difference of 0.79%), and Icelander (2.1%, a difference of 0.92%).
| Demographics | Rating | Rank | Doctorate Degree |
| Taiwanese | 96.7 /100 | #115 | Exceptional 2.1% |
| Maltese | 96.2 /100 | #116 | Exceptional 2.1% |
| Lebanese | 96.0 /100 | #117 | Exceptional 2.1% |
| Icelanders | 96.0 /100 | #118 | Exceptional 2.1% |
| Pakistanis | 95.8 /100 | #119 | Exceptional 2.0% |
| Immigrants | Morocco | 95.5 /100 | #120 | Exceptional 2.0% |
| Immigrants | Jordan | 94.8 /100 | #121 | Exceptional 2.0% |
| Immigrants | Southern Europe | 94.7 /100 | #122 | Exceptional 2.0% |
| Croatians | 94.0 /100 | #123 | Exceptional 2.0% |
| Ute | 93.2 /100 | #124 | Exceptional 2.0% |
| Moroccans | 93.0 /100 | #125 | Exceptional 2.0% |
| Jordanians | 92.1 /100 | #126 | Exceptional 2.0% |
| Palestinians | 92.0 /100 | #127 | Exceptional 2.0% |
| Immigrants | Zaire | 91.1 /100 | #128 | Exceptional 2.0% |
| Canadians | 90.6 /100 | #129 | Exceptional 2.0% |